
Markets
US Futures Markets are set for +1.0% gain for the opening bell.
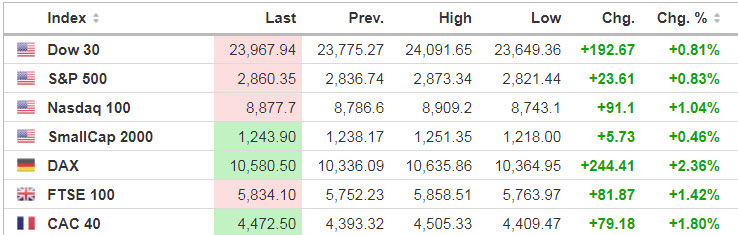
Source: https://www.investing.com/indices/indices-cfds
Economic Calendar
10:30 Dallas Fed Manufacturing Survey
1:00 PM Results of $43B, 5-Year Note Auction
https://www.investing.com/economic-calendar/
***New: PTG Trading Room Chat Log’s Link
***IMPORTANT >>> IF preset $risk parameters have been exceeded in your individual trade plan, THEN simply stand-aside or trade in simulation-mode until trade risk can properly be managed.
We’ll keep the “HIGH SURF WARNING FLAG” posted as volatility remains elevated, with VIX 36 and ATR (3) 73 handles.

S&P 500
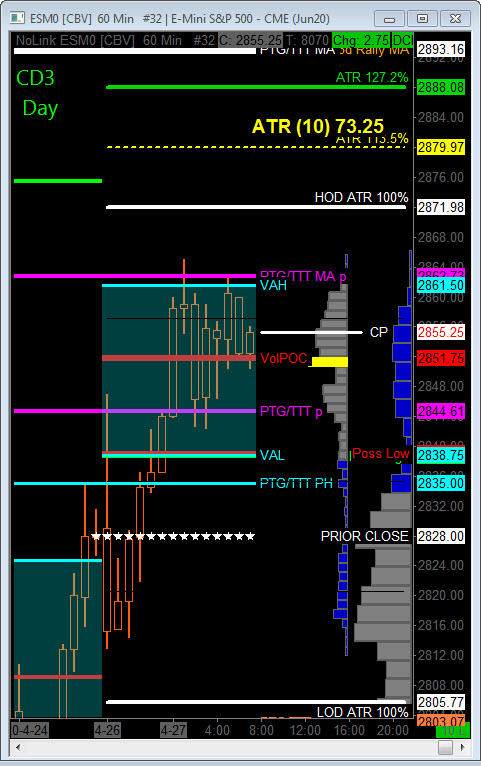
Prior Session was Cycle Day 2 (CD2): Price held early test of Cycle Day 1 Low (2772.75) at which time this cycle’s rally began throughout the session closing the week on a strong uptick.
…Transition from Cycle Day 2 to Cycle Day 3
This leads us into Cycle Day 3 (CD3): Price has extended beyond PH (2835) pushing higher fulfilling CD3 Penetration Target (2862.75) Further Cycle target measures 2893. Positive 3 Day Cycle Statistic is confirmed as bulls remain in-control.
PVA High Edge = 2825 PVA Low Edge = 2784 Prior POC = 2791
Bull Scenario: IF Bulls hold bid above 2850, THEN initial upside estimate targets 2860 – 2863 zone.
Bear Scenario: IF Bears hold offer below 2850, THEN initial downside estimate targets 2840 – 2835 zone.
Range Projections and Key Levels (ES) June 2020 (M) Contract
HOD ATR Range Projection: 2872; LOD ATR Range Projection: 2806; 3 Day Central Pivot: 2762; 3 Day Cycle Target: 2893; 10 Day Average True Range 73; VIX: 36
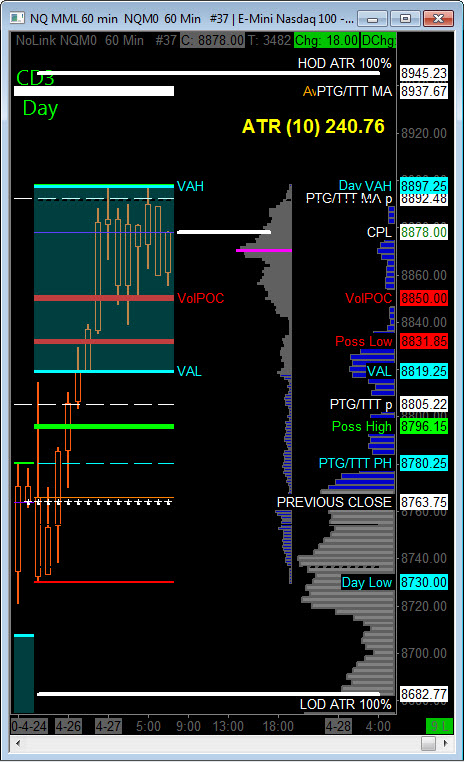
Nasdaq 100 (NQ)
Today is Cycle Day 3 (CD3)…Price has rallied from prior close during overnight trade fulfilling CD3 Penetration Target (8892.50). Bulls remain firmly in-control. Reversal below PH (8780.25) back into prior session’s range would pause the bullish sentiment.
PVA High Edge = 8708 PVA Low Edge = 8535 Prior POC = 8635
Bull Scenario: IF Bulls hold bid above 8850, THEN initial upside estimate targets 8875 – 8893 zone.
Bear Scenario: IF Bears hold offer below 8850, THEN initial downside estimate targets 8835 – 8805 zone.
Range Projections and Key Levels (NQ) June 2020 (M) Contract
HOD ATR Range Projection: 8945; LOD ATR Range Projection: 8683; 3 Day Central Pivot: 8638; 3 Day Cycle Target: 8938; 10 Day Average True Range: 241; VIX: 36
Trade Strategy: Our tactical trade strategy will simply remain unaltered…We’ll be flexible to trade both long and short side from Decision Pivot Levels. Continue to focus on Bull/Bear Stackers and Premium/Discounts. As always, remaining in alignment with dominant intra-day force increases probabilities of producing winning trades.
Stay Focused…Non-Biased…Disciplined ALWAYS USE STOPS!
Good Trading…David
“Knowing is not enough, We must APPLY. Willing is not enough, We must DO.” –Bruce Lee
*****This trade strategy report is disseminated for “education only” and should not be viewed in any way as a recommendation to buy or sell futures products.”
PAST PERFORMANCE IS NOT NECESSARILY INDICATIVE OF FUTURE RESULTS
IMPORTANT NOTICE! No representation is being made that the use of this strategy or any system or trading methodology will generate profits. Past performance is not necessarily indicative of future results. There is substantial risk of loss associated with trading securities and options on equities. Only risk capital should be used to trade. Trading securities is not suitable for everyone.
Disclaimer: Futures, Options, and Currency trading all have large potential rewards, but they also have large potential risk. You must be aware of the risks and be willing to accept them in order to invest in these markets. Don’t trade with money you can’t afford to lose.
This website is neither a solicitation nor an offer to Buy/Sell futures, options, or currencies. No representation is being made that any account will or is likely to achieve profits or losses similar to those discussed on this web site. The past performance of any trading system or methodology is not necessarily indicative of future results.
CFTC RULE 4.41 –HYPOTHETICAL OR SIMULATED PERFORMANCE RESULTS HAVE CERTAIN LIMITATIONS. UNLIKE AN ACTUAL PERFORMANCE RECORD, SIMULATED RESULTS DO NOT REPRESENT ACTUAL TRADING. ALSO, SINCE THE TRADES HAVE NOT BEEN EXECUTED, THE RESULTS MAY HAVE UNDER-OR-OVER COMPENSATED FOR THE IMPACT, IF ANY, OF CERTAIN MARKET FACTORS, SUCH AS LACK OF LIQUIDITY. SIMULATED TRADING PROGRAMS IN GENERAL ARE ALSO SUBJECT TO THE FACT THAT THEY ARE DESIGNED WITH THE BENEFIT OF HINDSIGHT. NO REPRESENTATION IS BEING MADE THAT ANY ACCOUNT WILL OR IS LIKELY TO ACHIEVE PROFIT OR LOSSES SIMILAR TO THOSE SHOWN