
Markets
U.S. equity index futures are pointing to gains of 0.3% at the open, meaning the DJIA will only need to gain another 70 points during today’s session to top its record close of 26,828 posted last October.
In Asia, Japan +0.1%. Hong Kong +0.1%. China +0.2%. India -0.1%.
In Europe, at midday, London flat. Paris -0.2%. Frankfurt -0.5%.
Futures at 6:20, Dow +0.3%. S&P +0.3%. Nasdaq +0.3%. Crude +0.9% to $58.01. Gold +0.7% to $1409.50. Bitcoin +2.3% to $10878.
Ten-year Treasury Yield -3 bps to 2.03%
Source: Seeking Alpha https://seekingalpha.com
Economic Calendar
8:30Chicago Fed National Activity Index
10:30Dallas Fed Manufacturing Survey
***PTG Trading Room Chat Log’s Link
S&P 500
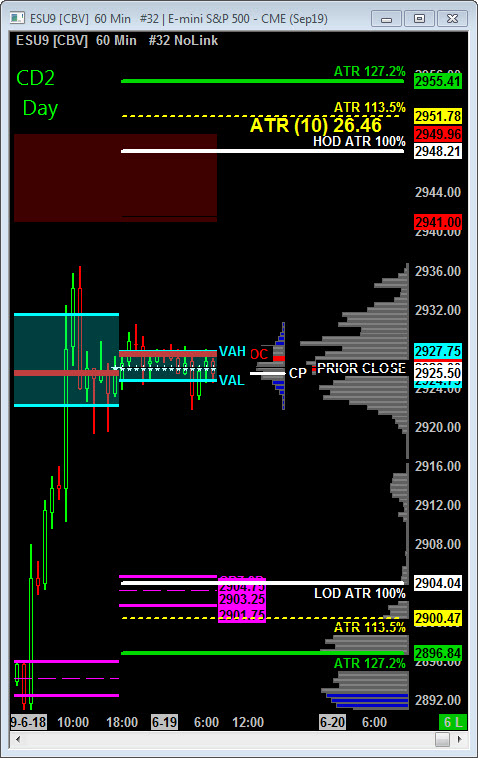
Today is Cycle Day 2 (CD2)…Rollover and Option QUAD Expiration are both complete; Summer 2019 has begun and the Stock Market is just shy of all-time high. Trading opportunities have been plentiful this 1st half of year…Let’s keep it going! Trade disciplined and stay focused.
CD2 Range High = 2971.25 CD2 Range Low = 2937.75 CD2 Range Avg = 29.00
Scenario 1: IF Bulls hold bid above 2956, THEN initial upside potential targets 2966 – 2970 zone.
Scenario 2: IF Bears hold offer below 2956, THEN initial downside objective targets 2944 – 2936 zone.
Range Projections and Key Levels (ES) September 2019 (U) Contract
HOD ATR Range Projection: 2972.50; LOD ATR Range Projection: 2936.50; 3 Day Central Pivot: 2945.00; 3 Day Cycle Target: 2988.00; 10 Day Average True Range 25.13: VIX: 15.50
Nasdaq 100 (NQ)
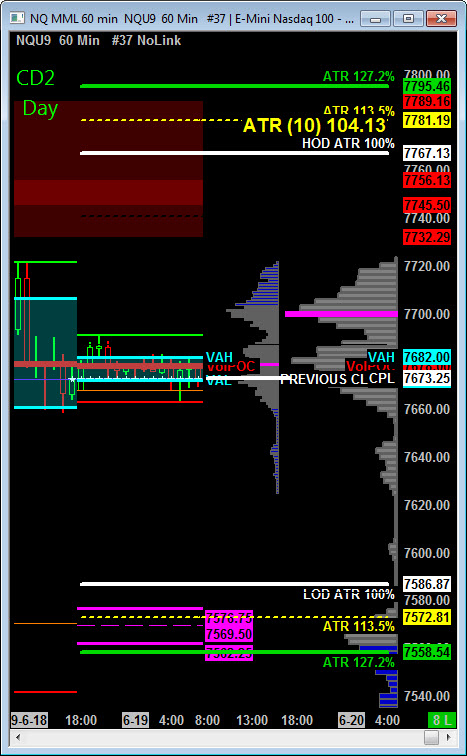
Today is Cycle Day 2 (CD2)…Price is trading in a relatively narrow range within prior session range edges marked 7800 – 7720.
CD2 Range High = 7790.00 CD2 Range Low = 7736.00 CD2 Range Avg = 104.00
Scenario 1: IF Bulls hold bid above 7775, THEN initial upside potential targets 7790 – 7795 zone.
Scenario 2: IF Bears hold offer below 7775, THEN initial downside objective targets 7760 – 7750 zone.
Range Projections and Key Levels (NQ) September 2019 (U) Contract
HOD ATR Range Projection: 7829.00; LOD ATR Range Projection: 7696.00; 3 Day Central Pivot: 7732.00; 3 Day Cycle Target: 7795.00; 10 Day Average True Range: 98.00; VIX: 15.50
Trade Strategy: Our tactical trade strategy will simply remain unaltered…We’ll be flexible to trade both long and short side from Decision Pivot Levels. Continue to focus on Bull/Bear Stackers and Premium/Discounts. As always, remaining in alignment with dominant intra-day force increases probabilities of producing winning trades.
Stay Focused…Non-Biased…Disciplined ALWAYS USE STOPS!
Good Trading…David
“Knowing is not enough, We must APPLY. Willing is not enough, We must DO.” –Bruce Lee
*****This trade strategy report is disseminated for “education only” and should not be viewed in any way as a recommendation to buy or sell futures products.”
PAST PERFORMANCE IS NOT NECESSARILY INDICATIVE OF FUTURE RESULTS
IMPORTANT NOTICE! No representation is being made that the use of this strategy or any system or trading methodology will generate profits. Past performance is not necessarily indicative of future results. There is substantial risk of loss associated with trading securities and options on equities. Only risk capital should be used to trade. Trading securities is not suitable for everyone.
Disclaimer: Futures, Options, and Currency trading all have large potential rewards, but they also have large potential risk. You must be aware of the risks and be willing to accept them in order to invest in these markets. Don’t trade with money you can’t afford to lose.
This website is neither a solicitation nor an offer to Buy/Sell futures, options, or currencies. No representation is being made that any account will or is likely to achieve profits or losses similar to those discussed on this web site. The past performance of any trading system or methodology is not necessarily indicative of future results.
CFTC RULE 4.41 –HYPOTHETICAL OR SIMULATED PERFORMANCE RESULTS HAVE CERTAIN LIMITATIONS. UNLIKE AN ACTUAL PERFORMANCE RECORD, SIMULATED RESULTS DO NOT REPRESENT ACTUAL TRADING. ALSO, SINCE THE TRADES HAVE NOT BEEN EXECUTED, THE RESULTS MAY HAVE UNDER-OR-OVER COMPENSATED FOR THE IMPACT, IF ANY, OF CERTAIN MARKET FACTORS, SUCH AS LACK OF LIQUIDITY. SIMULATED TRADING PROGRAMS IN GENERAL ARE ALSO SUBJECT TO THE FACT THAT THEY ARE DESIGNED WITH THE BENEFIT OF HINDSIGHT. NO REPRESENTATION IS BEING MADE THAT ANY ACCOUNT WILL OR IS LIKELY TO ACHIEVE PROFIT OR LOSSES SIMILAR TO THOSE SHOWN