
Markets
In Asia, Japan +2%. Hong Kong +1.1%. China +0.8%. India -1.4%.
In Europe, at midday, London -0.2%. Paris -0.2%. Frankfurt flat.
Futures at 6:20, Dow +0.4%. S&P +0.4%. Nasdaq +0.5%. Crude +1.4% to $56.19. Gold +0.8% to $1439.10. Bitcoin +5.1% to $10326.
Ten-year Treasury Yield flat at 2.04%
(Source: Seeking Alpha) https://seekingalpha.com/
Economic Calendar
10:00Consumer Sentiment
11:05Fed’s Bullard: “Technology and the Future of the Monetary and Financial System”
1:00 PMBaker-Hughes Rig Count
*****New PTG Trading Room Chat Log’s Link
S&P 500
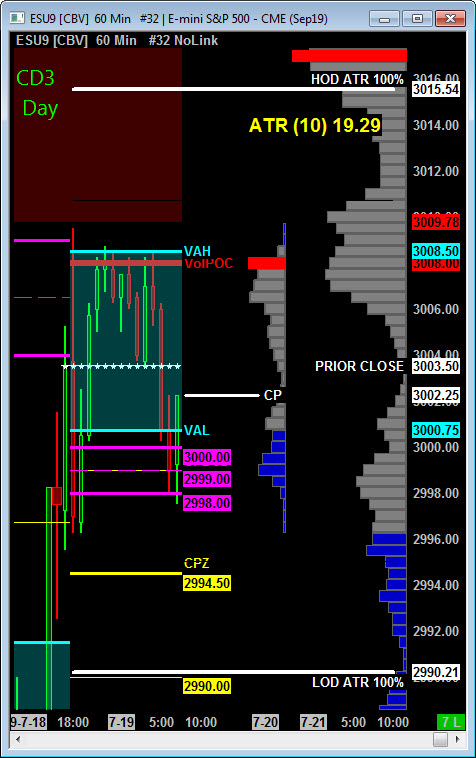
Today is Cycle Day 3 …Price has fulfilled 3008.50 Positive 3 Day Rally Statistic Target. As such the next pullback/decline could unfold anytime. Initial support is marked with 2998 – 3000 3 Day Central Pivot Zone. Lower support marked between 2985 – 2990 zone. There’s lots of real-estate for price to move around given recent wide range days. Hot Summer Sizzling Friday…Keep Kool!
CD3 Range High = 3020.00 CD3 Range Low = 2985.00 CD3 Range Avg = 32.00
Scenario 1: IF Bulls hold bid above 3000, THEN upside targets 3010 – 3015 zone.
Scenario 2: IF Bears hold offer below 3000, THEN downside targets 2995 – 2990 zone.
Range Projections and Key Levels (ES) September (U) Contract
HOD ATR Range Projection: 3015.00; LOD ATR Range Projection: 2990; Cycle Day 1 Low: 2980.50; 3 Day Central Pivot: 3000.00; 3 Day Cycle Target: 3008.50; 10 Day Average True Range 19.29; VIX: 13.67
Nasdaq 100 (NQ)
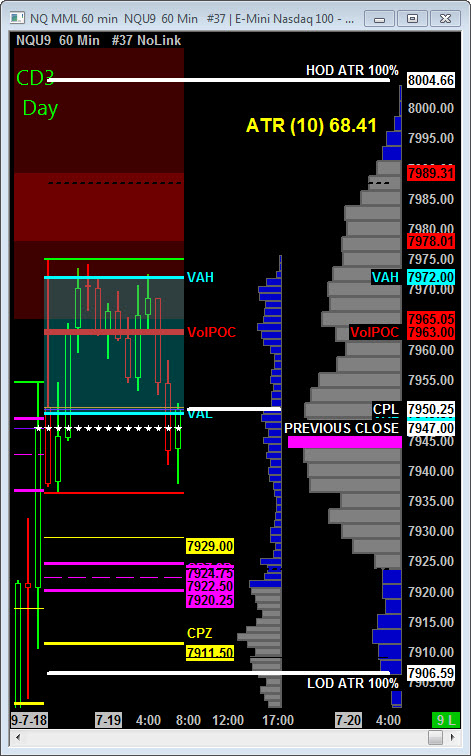
Today is Cycle Day 3… Price has fulfilled 7938 Positive 3 Day Rally Statistic Target. As such the next pullback/decline could unfold anytime. Initial support is marked with 7925 – 7920 3 Day Central Pivot Zone.
CD3 Range High = 7994.00 CD3 Range Low = 7918.00 CD3 Range Avg = 110.50
Scenario 1: IF Bulls hold bid above 7945, THEN upside potential targets 7972 – 7978 zone..
Scenario 2: IF Bears hold offer below 7945, THEN downside targets 7930 – 7920 zone.
Range Projections and Key Levels (NQ) September (U) Contract
HOD ATR Range Projection: 8005.00; LOD ATR Range Projection: 7906.00; Cycle Day 1 Low: 7868.00; 3 Day Central Pivot: 7922.50; 3 Day Cycle Target: 7938.00; 10 Day Average True Range: 68.41; VIX: 13.67
Trade Strategy: Our tactical trade strategy will simply remain unaltered…We’ll be flexible to trade both long and short side from Decision Pivot Levels. Continue to focus on Bull/Bear Stackers and Premium/Discounts. As always, remaining in alignment with dominant intra-day force increases probabilities of producing winning trades.
Stay Focused…Non-Biased…Disciplined ALWAYS USE STOPS!
Good Trading…David
“Knowing is not enough, We must APPLY. Willing is not enough, We must DO.” –Bruce Lee
*****This trade strategy report is disseminated for “education only” and should not be viewed in any way as a recommendation to buy or sell futures products.”
PAST PERFORMANCE IS NOT NECESSARILY INDICATIVE OF FUTURE RESULTS
IMPORTANT NOTICE! No representation is being made that the use of this strategy or any system or trading methodology will generate profits. Past performance is not necessarily indicative of future results. There is substantial risk of loss associated with trading securities and options on equities. Only risk capital should be used to trade. Trading securities is not suitable for everyone.
Disclaimer: Futures, Options, and Currency trading all have large potential rewards, but they also have large potential risk. You must be aware of the risks and be willing to accept them in order to invest in these markets. Don’t trade with money you can’t afford to lose.
This website is neither a solicitation nor an offer to Buy/Sell futures, options, or currencies. No representation is being made that any account will or is likely to achieve profits or losses similar to those discussed on this web site. The past performance of any trading system or methodology is not necessarily indicative of future results.
CFTC RULE 4.41 –HYPOTHETICAL OR SIMULATED PERFORMANCE RESULTS HAVE CERTAIN LIMITATIONS. UNLIKE AN ACTUAL PERFORMANCE RECORD, SIMULATED RESULTS DO NOT REPRESENT ACTUAL TRADING. ALSO, SINCE THE TRADES HAVE NOT BEEN EXECUTED, THE RESULTS MAY HAVE UNDER-OR-OVER COMPENSATED FOR THE IMPACT, IF ANY, OF CERTAIN MARKET FACTORS, SUCH AS LACK OF LIQUIDITY. SIMULATED TRADING PROGRAMS IN GENERAL ARE ALSO SUBJECT TO THE FACT THAT THEY ARE DESIGNED WITH THE BENEFIT OF HINDSIGHT. NO REPRESENTATION IS BEING MADE THAT ANY ACCOUNT WILL OR IS LIKELY TO ACHIEVE PROFIT OR LOSSES SIMILAR TO THOSE SHOWN