
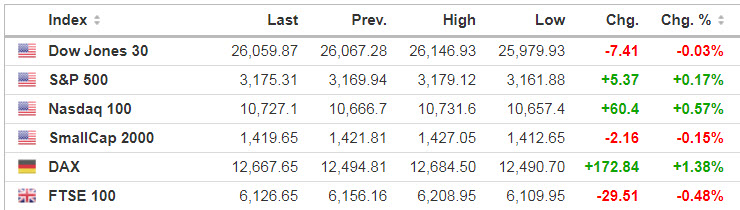
Markets
Tech stock love saw Nasdaq futures rise overnight, while Dow and S&P 500 futures inched lower, following a turnaround on Wednesday that saw all three indexes close back in the green.
Source: Seeking Alpha https://seekingalpha.com/
Source: https://www.investing.com/indices/indices-cfds
Economic Calendar
8:30 Initial Jobless Claims
10:00 Wholesale Trade
10:30 EIA Natural Gas Inventory

Sentiment also got a boost on Wednesday after St. Louis Fed President James Bullard said that the jobless rate could fall substantially by the end of 2020. It’s been quite a run for the unemployment rate, which was at a 50-year low of 3.5% just five months ago before spiking up to 14.7% in April (it currently stands at 11.1%).
Source: https://www.investing.com/economic-calendar/
S&P 500 (ES)
Prior Session was Cycle Day 1 (CD1): Price established a “secure” cycle low early in the session. When that scenario occurs, typically signals underlying strength evolving into rally which is exactly what unfolded, closing near session high.
…Transition from Cycle Day 1 to Cycle Day 2
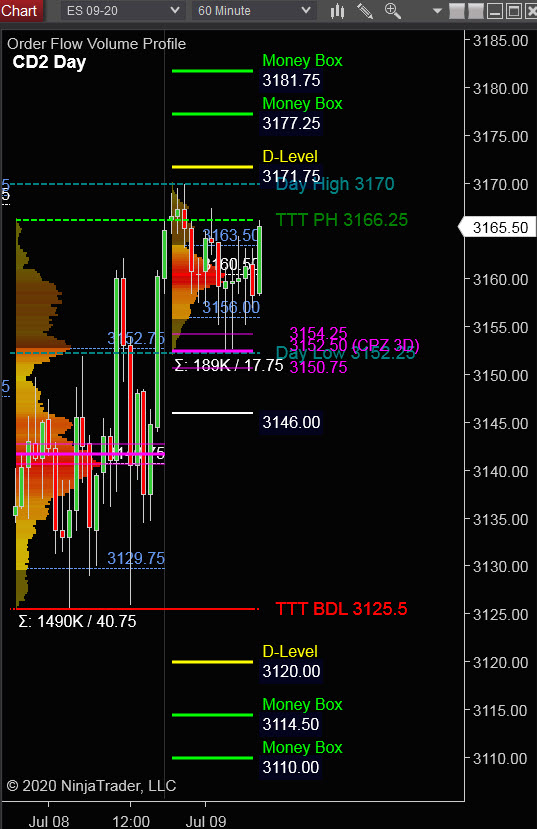
This leads us into Cycle Day 2 (CD2): Price is continuing where it left off during prior session, with a sustained underlying bid, holding support within 3 Day Central Pivot Zone (3150 – 3155). We have two scenarios to consider for today’s trading.
1.) Price sustains a bid above 3160, initially targeting 3170 (ONH), then within Money Box Zone (3177 – 3182).
2.) Price sustains an offer below 3160 initially targeting 3150 – 3145 zone.
P -VA High = 3152 P – VA Low = 3130 P – POC = 3142
Range Projections and Key Levels (ES) September 2020 (U) Contract
HOD ATR Range Projection: 3203; LOD ATR Range Projection: 3120; 3 Day Central Pivot: 3152; 3 Day Cycle Target: 3200; 10 Day Average True Range 50; VIX: 28
Nasdaq 100 (NQ)
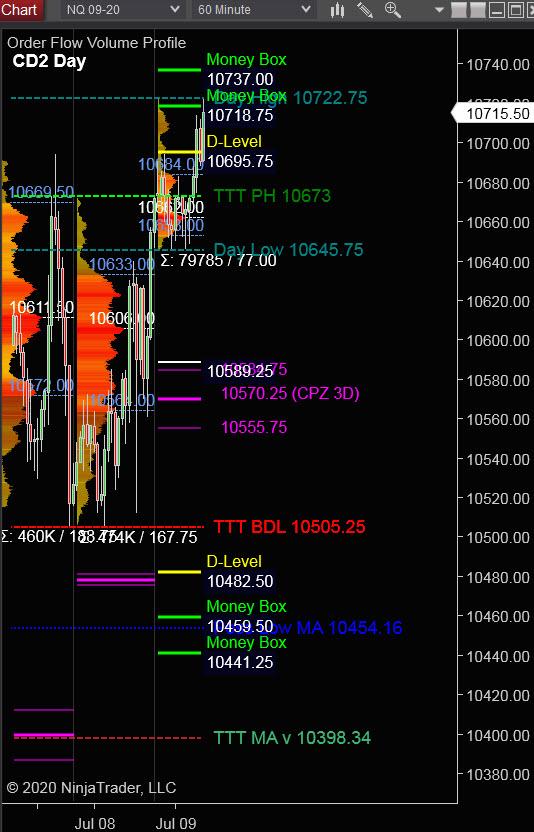
Today is Cycle Day 2 (CD2)… Price has extended this cycle’s rally above 10673 (PH), into Money Box Zone (10719 – 10737). We have two scenarios to consider for today’s trading:
P – VA High = 10370 P – VA Low = 10333 P – POC = 10350
Bull Scenario: IF Bulls sustain a bid above 10695, THEN initial upside estimate targets 10775 – 10784 zone.
Bear Scenario: IF Bears sustain an offer below 10695, THEN initial downside estimate targets 10675 – 10645 zone.
Range Projections and Key Levels (NQ) September 2020 (U) Contract
HOD ATR Range Projection: 10840; LOD ATR Range Projection: 10528; 3 Day Central Pivot: 10570; 3 Day Cycle Target: 10775; 10 Day Average True Range: 194; VIX: 28
Trade Strategy: Our tactical trade strategy will simply remain unaltered…We’ll be flexible to trade both long and short side from Decision Pivot Levels. Continue to focus on Bull/Bear Stackers and Premium/Discounts. As always, remaining in alignment with dominant intra-day force increases probabilities of producing winning trades.
Stay Focused…Non-Biased…Disciplined ALWAYS USE STOPS!
Good Trading…David
“Knowing is not enough, We must APPLY. Willing is not enough, We must DO.” –Bruce Lee
*****This trade strategy report is disseminated for “education only” and should not be viewed in any way as a recommendation to buy or sell futures products.”
PAST PERFORMANCE IS NOT NECESSARILY INDICATIVE OF FUTURE RESULTS
IMPORTANT NOTICE! No representation is being made that the use of this strategy or any system or trading methodology will generate profits. Past performance is not necessarily indicative of future results. There is substantial risk of loss associated with trading securities and options on equities. Only risk capital should be used to trade. Trading securities is not suitable for everyone.
Disclaimer: Futures, Options, and Currency trading all have large potential rewards, but they also have large potential risk. You must be aware of the risks and be willing to accept them in order to invest in these markets. Don’t trade with money you can’t afford to lose.
This website is neither a solicitation nor an offer to Buy/Sell futures, options, or currencies. No representation is being made that any account will or is likely to achieve profits or losses similar to those discussed on this web site. The past performance of any trading system or methodology is not necessarily indicative of future results.
CFTC RULE 4.41 –HYPOTHETICAL OR SIMULATED PERFORMANCE RESULTS HAVE CERTAIN LIMITATIONS. UNLIKE AN ACTUAL PERFORMANCE RECORD, SIMULATED RESULTS DO NOT REPRESENT ACTUAL TRADING. ALSO, SINCE THE TRADES HAVE NOT BEEN EXECUTED, THE RESULTS MAY HAVE UNDER-OR-OVER COMPENSATED FOR THE IMPACT, IF ANY, OF CERTAIN MARKET FACTORS, SUCH AS LACK OF LIQUIDITY. SIMULATED TRADING PROGRAMS IN GENERAL ARE ALSO SUBJECT TO THE FACT THAT THEY ARE DESIGNED WITH THE BENEFIT OF HINDSIGHT. NO REPRESENTATION IS BEING MADE THAT ANY ACCOUNT WILL OR IS LIKELY TO ACHIEVE PROFIT OR LOSSES SIMILAR TO THOSE SHOWN