
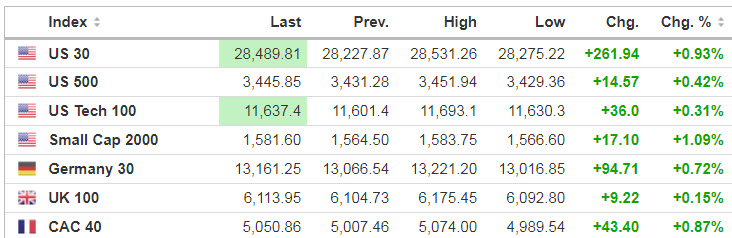
Markets
S&P 500 futures climbed 0.5% overnight after another record-setting session on Wall Street that saw the benchmark close above 3,400 for the first time.
Source: SeekingAlpha.com
Economic Calendar
8:55 Redbook Chain Store Sales
9:00 S&P Corelogic Case-Shiller Home Price Index
9:00 FHFA House Price Index
10:00 Consumer Confidence
10:00 New Home Sales
10:00 Richmond Fed Mfg.
1:00 PM Results of $50B, 2-Year Note Auction
https://www.investing.com/economic-calendar/
***New: PTG Trading Room Chat Log’s Link
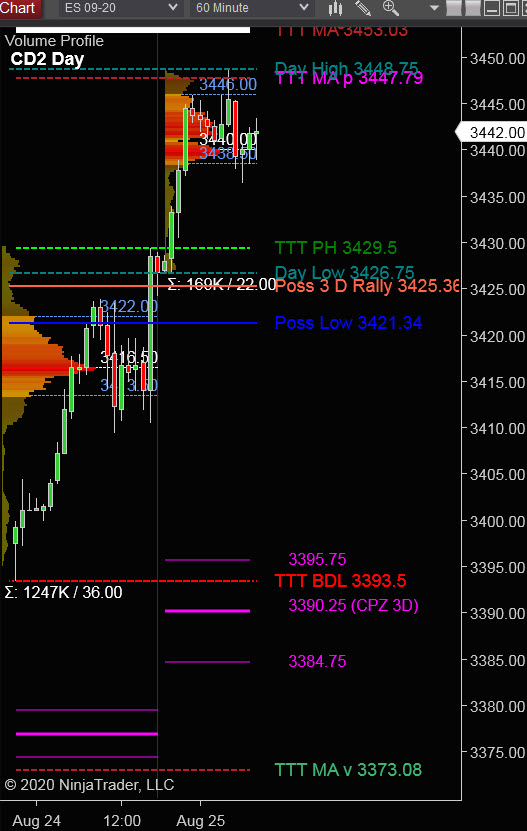
S&P 500
Prior Session was Cycle Day 1 (CD1): Gap up on RTH open sent price higher and never looked back, holding gains throughout the session. Market on Close Buy Imbalance of $2.2B kept firm bid. Range was 36.00 handles, above the 10-day average (31) on 1.247K contracts traded.
…Transition from Cycle Day 1 to Cycle Day 2
This leads us into Cycle Day 2 (CD2): Price has continued this cycle’s rally pushing higher to fulfill 3448 (CD2 Penetration Level). Price is above prior Value Zone so today we have two scenarios to consider for today’s trading.
1.) Price sustains a bid above 3440, initially targeting 3448 – 3454 zone.
2.) Price sustains an offer below 3440, initially targeting 3430 – 3425 zone.
*****3 Day Cycle has a 91% probability of fulfilling Positive Statistic covering 12 years of recorded tracking history.
PVA High Edge = 3422 PVA Low Edge = 3413 Prior POC = 3416
Range Projections and Key Levels (ES) September 2020 (U) Contract
HOD ATR Range Projection: 3424; LOD ATR Range Projection: 3398; 3 Day Central Pivot: 3390; 3 Day Cycle Target: 3425; 10 Day Average True Range 31; VIX: 22.00
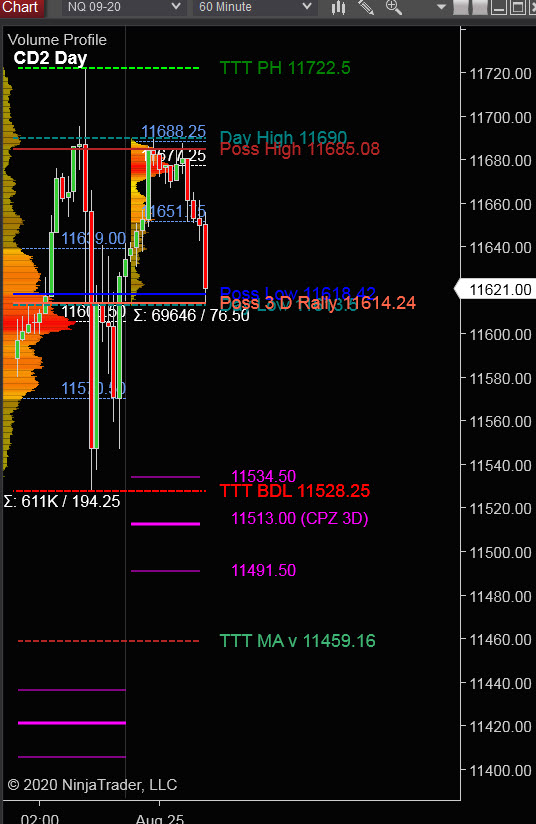
Nasdaq 100 (NQ)
Today is Cycle Day 2 (CD2)…Price has failed to sustain a bid above PH (11722) and as such is displaying negative index divergence. Range was 194.25 handles on 611K contracts traded. Price is within prior Value Zone so today we have two scenarios to consider:
PVA High Edge = 11640 PVA Low Edge = 11570 Prior POC = 11605
Bull Scenario: IF Bulls sustain a bid above 11605, THEN initial upside estimate targets 11640 – 11650 zone.
Bear Scenario: IF Bears sustain an offer below 11605, THEN initial downside estimate targets 11570 – 11535 zone.
Range Projections and Key Levels (NQ) September 2020 (U) Contract
HOD ATR Range Projection: 11708; LOD ATR Range Projection: 11542; 3 Day Central Pivot: 11513; 3 Day Cycle Target: 11614; 10 Day Average True Range: 180; VIX: 22.00
Trade Strategy: Our tactical trade strategy will simply remain unaltered…We’ll be flexible to trade both long and short side from Decision Pivot Levels. Continue to focus on Bull/Bear Stackers and Premium/Discounts. As always, remaining in alignment with dominant intra-day force increases probabilities of producing winning trades.
Stay Focused…Non-Biased…Disciplined ALWAYS USE STOPS!
Good Trading…David
“Knowing is not enough, We must APPLY. Willing is not enough, We must DO.” –Bruce Lee
*****This trade strategy report is disseminated for “education only” and should not be viewed in any way as a recommendation to buy or sell futures products.”
PAST PERFORMANCE IS NOT NECESSARILY INDICATIVE OF FUTURE RESULTS
IMPORTANT NOTICE! No representation is being made that the use of this strategy or any system or trading methodology will generate profits. Past performance is not necessarily indicative of future results. There is substantial risk of loss associated with trading securities and options on equities. Only risk capital should be used to trade. Trading securities is not suitable for everyone.
Disclaimer: Futures, Options, and Currency trading all have large potential rewards, but they also have large potential risk. You must be aware of the risks and be willing to accept them in order to invest in these markets. Don’t trade with money you can’t afford to lose.
This website is neither a solicitation nor an offer to Buy/Sell futures, options, or currencies. No representation is being made that any account will or is likely to achieve profits or losses similar to those discussed on this web site. The past performance of any trading system or methodology is not necessarily indicative of future results.
CFTC RULE 4.41 –HYPOTHETICAL OR SIMULATED PERFORMANCE RESULTS HAVE CERTAIN LIMITATIONS. UNLIKE AN ACTUAL PERFORMANCE RECORD, SIMULATED RESULTS DO NOT REPRESENT ACTUAL TRADING. ALSO, SINCE THE TRADES HAVE NOT BEEN EXECUTED, THE RESULTS MAY HAVE UNDER-OR-OVER COMPENSATED FOR THE IMPACT, IF ANY, OF CERTAIN MARKET FACTORS, SUCH AS LACK OF LIQUIDITY. SIMULATED TRADING PROGRAMS IN GENERAL ARE ALSO SUBJECT TO THE FACT THAT THEY ARE DESIGNED WITH THE BENEFIT OF HINDSIGHT. NO REPRESENTATION IS BEING MADE THAT ANY ACCOUNT WILL OR IS LIKELY TO ACHIEVE PROFIT OR LOSSES SIMILAR TO THOSE SHOWN