
Markets (Top Stories)

Leading up to the Federal Reserve’s March 21-22 monetary policy meeting, traders had been expecting the FOMC to ratchet up its key interest rate by 50 basis points because the economy appeared to be surprisingly robust. But then three U.S. banks failed – Silvergate Capital (SI), SVB (SIVB) and Signature Bank (SBNY) – and a fourth is teetering (check out the latest headlines related to First Republic (FRC)). That may have Fed policymakers rethinking their expectation for a rate hike today and their upcoming rate path, while the whole episode came during the Fed’s blackout period, creating even more uncertainty about what may lie ahead.
Backdrop: As a reminder, the Fed has increased its key rate for eight straight meetings, bringing the federal funds rate target range to 4.50%-4.75%, from 0.0%-0.25% in the past year, in its drive to push down inflation. Meanwhile, the core PCE price index, the central bank’s preferred inflation gauge, showed a jump of 4.7% Y/Y in February, up from 4.6% in January, but easing from 5.2% in March 2022. Don’t forget that efforts to shrink the bank’s balance sheet were upended last week, as financial institutions borrowed a whopping $153B from the Fed’s discount window (and $12B from the newly created Bank Term Funding Program), though assets from emergency lending tend to fall as soon as a crisis subsides, compared to holdings added under quantitative easing.
With regards to whether to hike or not, the decision won’t be easy. Inflation still remains very high and a pause now could signal there are deeper problems within the banking system. On the other hand, there are fears that the Fed is moving too far, too fast with its aggressive rate increases, and some see the current banking crisis as a direct result of tighter monetary policy. Ultimately, things will boil down to whether the financial stability problem has been limited to a handful of regional banks that has been successfully contained, or if something systematic has broken – with the possibility of the crisis morphing into something larger.
Source: SeekingAlpha.com
Economic Calendar
2:00 PM FOMC Announcement
2:30 PM Chairman Press Conference
https://www.investing.com/economic-calendar/
 10:30 EIA Petroleum Inventories

S&P 500

***Written Tuesday evening for Wednesday’s trading for contribution to MrTopStep’s “The Opening Print” publication.
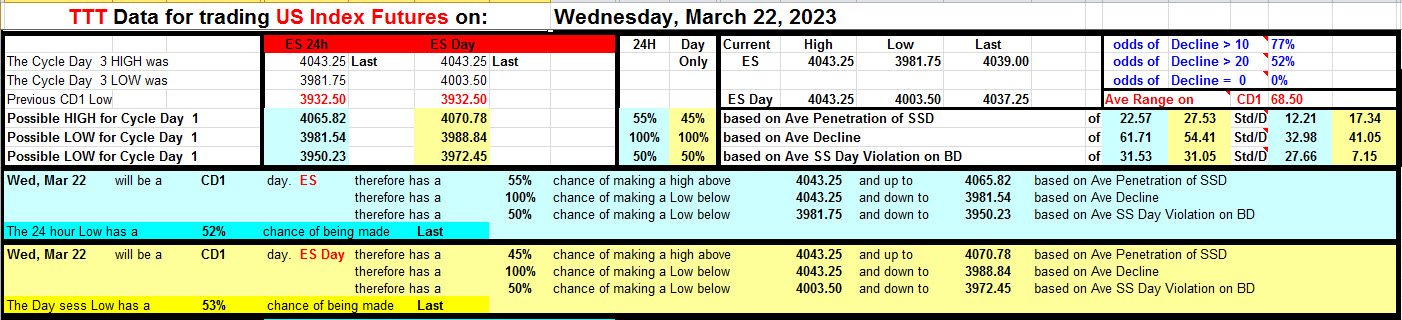
Prior Session was Cycle Day 3 (CD3): This cycle’s rally continued fulfilling and exceeding 3 Day Cycle Target (4013), as bullish sentiment regarding today’s FED Policy Statement and Presser. Prior range was 61 handles on 1.441M contracts exchanged.
…Transition from Cycle Day 3 to Cycle Day 1
This leads us into Cycle Day 1 (CD1): Average Decline for CD1 measures 3981. Price having closed near highs of day, momentum may push higher before the next decline begins. Wild-Card for today is of course the FED Policy Statement and Presser. Expectation is for FED to only increase rates by 25 bps, given the current Banking Sector turmoil. Regardless, PTG Method is steadfast in following price action and staying in alignment with the primary dominant force. As such, scenarios to consider for today’s trading.
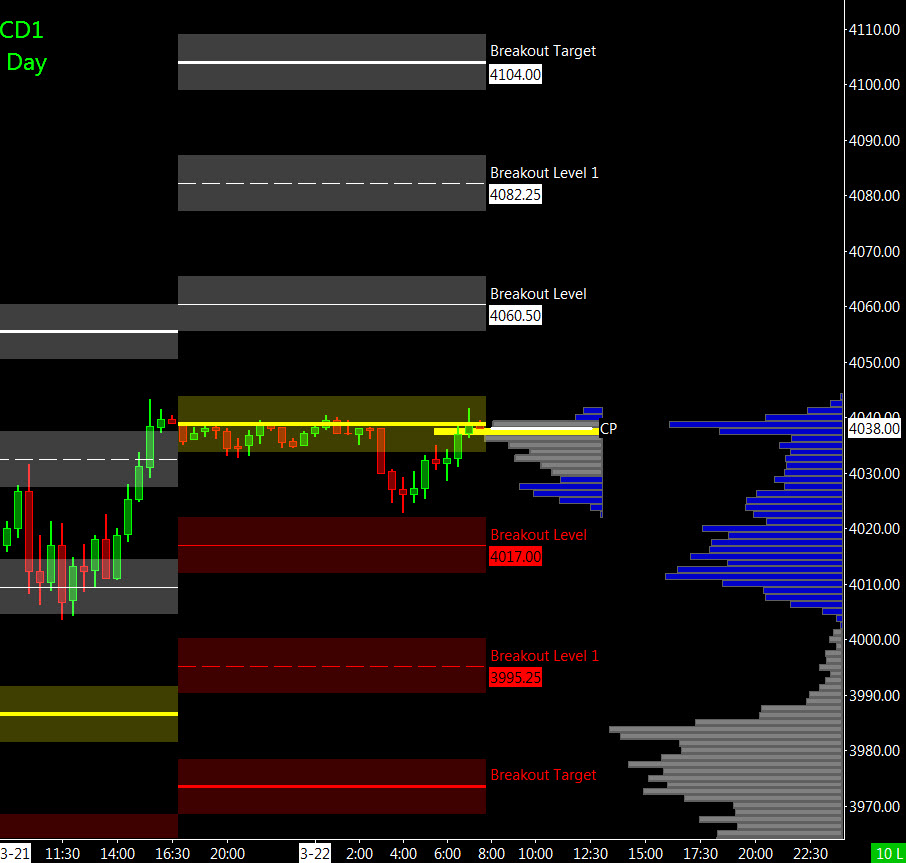
Bull Scenario: Price sustains a bid above 4040, initially targets 4060 – 4065 zone.
Bear Scenario: Price sustains an offer below 4040, initially targets 4020 – 4015 zone.
PVA High Edge = 4028 PVA Low Edge = 4006 Prior POC = 4011
*****The 3 Day Cycle has a 91% probability of fulfilling Positive Cycle Statistics covering 12 years of recorded tracking history.
For more detailed information for both bullish and bearish projected targets, please visit: PTG 3 Day Cycle and/or reference the Cycle Spreadsheet below:
Link to access full Cycle Spreadsheet > > Cycle Day 1 (CD1)
Range Projections and Key Levels (ES) June 2023 (M) Contract
HOD ATR Range Projection: 4112; LOD ATR Range Projection: 3952; 3 Day Central Pivot: 3981; 3 Day Cycle Target: 4109; 10 Day Average True Range 89; VIX: 21
Nasdaq 100 (NQ)

Prior Session was Cycle Day 3 (CD3): This cycle’s rally continued fulfilling 3 Day Cycle Range Objectives, as bullish sentiment regarding today’s FED Policy Statement. Prior range was 221 handles on 557k contracts exchanged.
…Transition from Cycle Day 3 to Cycle Day 1
This leads us into Cycle Day 1 (CD1): Average Decline for CD1 measures 12661. Price having closed near highs of day, momentum may push higher before the next decline begins. Wild-Card for today is of course the FED Policy Statement and Presser. Expectation is for FED to only increase rates by 25 bps, given the current Banking Sector turmoil. Regardless, PTG Method is steadfast in following price action and staying in alignment with the primary dominant force. As such, scenarios to consider for today’s trading.
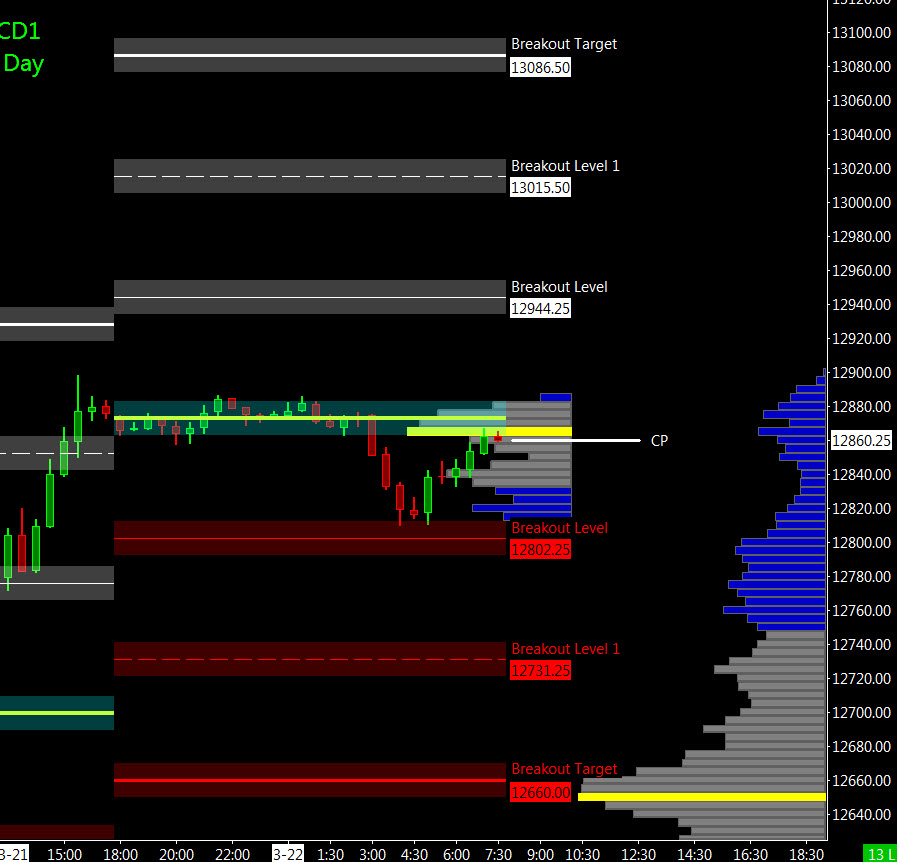
Bull Scenario: IF Bulls sustains bid above 12870, THEN initial upside estimate targets 13015– 13025 zone.
Bear Scenario: IF Bears sustains offer below 12870, THEN initial downside estimate targets 12740 – 12720 zone.
PVA High Edge = 12816 PVA Low Edge = 12719 Prior POC = 12772
Range Projections and Key Levels (NQ) June 2023 (M) Contract
HOD ATR Range Projection: 13110; LOD ATR Range Projection: 12585; 3 Day Central Pivot: 12716; 3 Day Cycle Target: 13085; 10 Day Average True Range: 301; VIX: 21
Trade Strategy: Our tactical trade strategy will simply remain unaltered…We’ll be flexible to trade both long and short side from Decision Pivot Levels. Continue to focus on Bull/Bear Stackers and Premium/Discounts. As always, remaining in alignment with dominant intra-day force increases probabilities of producing winning trades.
Stay Focused…Non-Biased…Disciplined ALWAYS USE STOPS!
Good Trading…David
“Knowing is not enough, We must APPLY. Willing is not enough, We must DO.” –Bruce Lee
*****This trade strategy report is disseminated for “education only” and should not be viewed in any way as a recommendation to buy or sell futures products.”
PAST PERFORMANCE IS NOT NECESSARILY INDICATIVE OF FUTURE RESULTS
IMPORTANT NOTICE! No representation is being made that the use of this strategy or any system or trading methodology will generate profits. Past performance is not necessarily indicative of future results. There is substantial risk of loss associated with trading securities and options on equities. Only risk capital should be used to trade. Trading securities is not suitable for everyone.
Disclaimer: Futures, Options, and Currency trading all have large potential rewards, but they also have large potential risk. You must be aware of the risks and be willing to accept them in order to invest in these markets. Don’t trade with money you can’t afford to lose.
This website is neither a solicitation nor an offer to Buy/Sell futures, options, or currencies. No representation is being made that any account will or is likely to achieve profits or losses similar to those discussed on this web site. The past performance of any trading system or methodology is not necessarily indicative of future results.
CFTC RULE 4.41 –HYPOTHETICAL OR SIMULATED PERFORMANCE RESULTS HAVE CERTAIN LIMITATIONS. UNLIKE AN ACTUAL PERFORMANCE RECORD, SIMULATED RESULTS DO NOT REPRESENT ACTUAL TRADING. ALSO, SINCE THE TRADES HAVE NOT BEEN EXECUTED, THE RESULTS MAY HAVE UNDER-OR-OVER COMPENSATED FOR THE IMPACT, IF ANY, OF CERTAIN MARKET FACTORS, SUCH AS LACK OF LIQUIDITY. SIMULATED TRADING PROGRAMS IN GENERAL ARE ALSO SUBJECT TO THE FACT THAT THEY ARE DESIGNED WITH THE BENEFIT OF HINDSIGHT. NO REPRESENTATION IS BEING MADE THAT ANY ACCOUNT WILL OR IS LIKELY TO ACHIEVE PROFIT OR LOSSES SIMILAR TO THOSE SHOWN