
Markets
U.S. stock markets will be closed on Wednesday, June 19 in observance of Juneteenth.

Economic Calendar
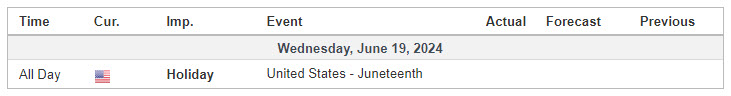
NOTE: Although US Cash Markets are closed for the holiday, Futures Markets will be open until 1:15 et. As such, normal 3-Day Cycle Pattern is tracked. See Below:
S&P 500

Prior Session was Cycle Day 3: Markets closed on their highs as the third 3-Day “Super” Cycle of the previous four cycles was achieved with a range expansion to 137.42% or 96.25 pts as compared to an average cycle range of 70 handles. Range for ES was 21 handles on 996k contracts exchanged.
…Transition from Cycle Day 3 to Cycle Day 1
This leads us into Cycle Day 1: Normal for CD1 would be for an average decline measuring between the 5528 (primary) – 5506 (secondary) levels. Bulls continue to be the dominant force, so it is theirs to lose. Our discipline of maintaining positioning that is aligned with market forces continues to serve us well, so stay the course.
As such, scenarios to consider for today’s trading.
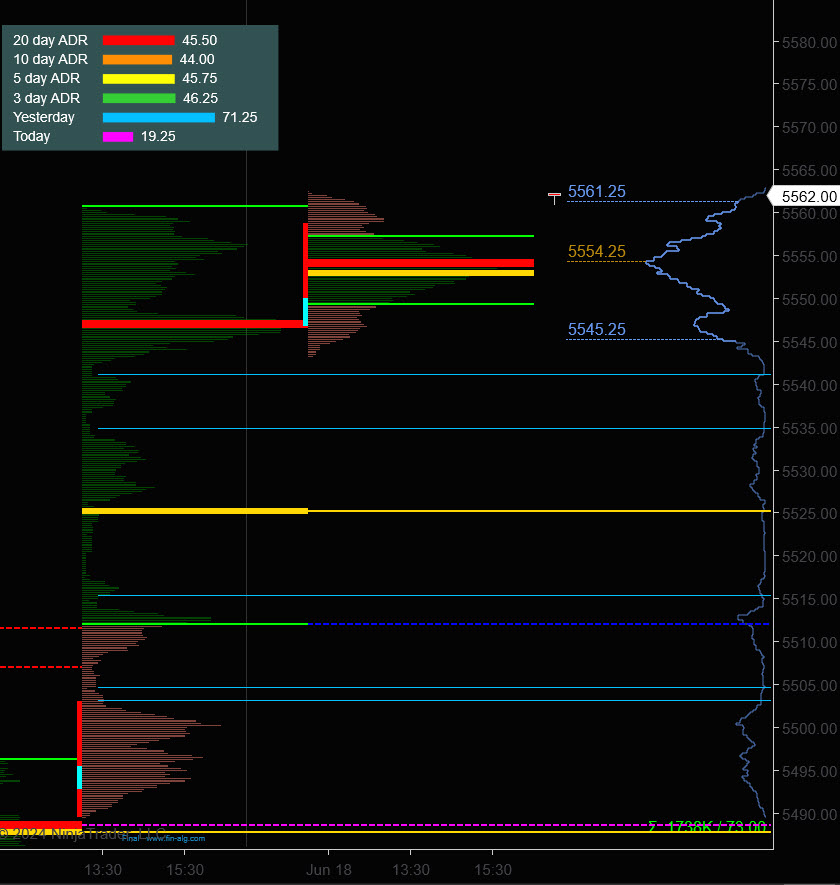
Bull Scenario: Price sustains a bid above 5540, initially targets 5570 – 5575 zone.
Bear Scenario: Price sustains an offer below 5540, initially targets 5530 – 5525 zone.
PVA High Edge = 5562 PVA Low Edge = 5546 Prior POC = 5554
PTG 3 Day Cycle
EXCLUSIVE OFFER

*****The 3 Day Cycle has a 92.50% probability of fulfilling Positive Cycle Statistics covering 12 years of recorded tracking history.
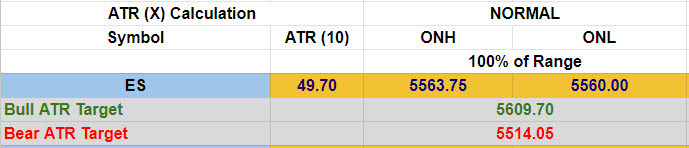
Link to: Range Projections (ES) Sept (U) 2024
ES Chart
Nasdaq 100 (NQ)

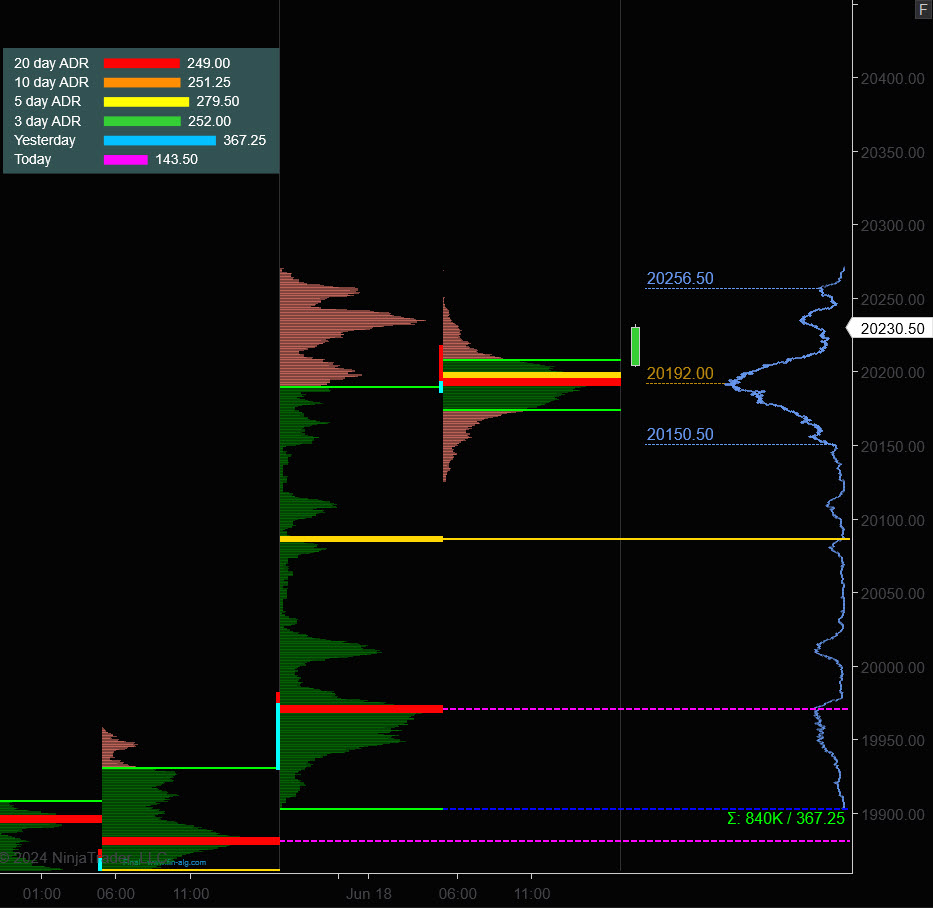
Prior Session was Cycle Day 3: Markets consolidated recent gains during this session as cycle targets were well eclipsed during another 3-Day “Super” Cycle. Range for NQ was 143 handles on 489k contracts exchanged.
…Transition from Cycle Day 3 to Cycle Day 1
This leads us into Cycle Day 1: Normal for CD1 would be for an average decline measuring between the 20153 (primary) – 20031 (secondary) levels. Bulls continue to be the dominant force, so it is theirs to lose. Our discipline of maintaining positioning that is aligned with market forces continues to serve us well, so stay the course.
Bull Scenario: Price sustains a bid above 20150, initially targets 20270 – 20315 zone.
Bear Scenario: Price sustains an offer below 20150, initially targets 20100 – 20060 zone.
PVA High Edge = 20209 PVA Low Edge = 20174 Prior POC = 20192
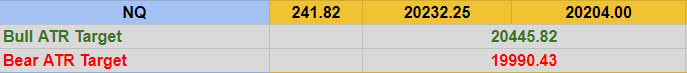
Link to: Range Projections (NQ) Sept (U) 2024
NQ Chart
Trade Strategy: Our tactical trade strategy will simply remain unaltered…We’ll be flexible to trade both long and short side from Decision Pivot Levels. Continue to focus on Bull/Bear Stackers and Premium/Discounts. As always, remaining in alignment with dominant intra-day force increases probabilities of producing winning trades.
Stay Focused…Non-Biased…Disciplined ALWAYS USE STOPS!
Good Trading…David
“Knowing is not enough, We must APPLY. Willing is not enough, We must DO.” –BR
*****This trade strategy report is disseminated for “education only” and should not be viewed in any way as a recommendation to buy or sell futures products.”
PAST PERFORMANCE IS NOT NECESSARILY INDICATIVE OF FUTURE RESULTS
IMPORTANT NOTICE! No representation is being made that the use of this strategy or any system or trading methodology will generate profits. Past performance is not necessarily indicative of future results. There is substantial risk of loss associated with trading securities and options on equities. Only risk capital should be used to trade. Trading securities is not suitable for everyone.
Disclaimer: Futures, Options, and Currency trading all have large potential rewards, but they also have large potential risk. You must be aware of the risks and be willing to accept them in order to invest in these markets. Don’t trade with money you can’t afford to lose.
This website is neither a solicitation nor an offer to Buy/Sell futures, options, or currencies. No representation is being made that any account will or is likely to achieve profits or losses similar to those discussed on this web site. The past performance of any trading system or methodology is not necessarily indicative of future results.
CFTC RULE 4.41 –HYPOTHETICAL OR SIMULATED PERFORMANCE RESULTS HAVE CERTAIN LIMITATIONS. UNLIKE AN ACTUAL PERFORMANCE RECORD, SIMULATED RESULTS DO NOT REPRESENT ACTUAL TRADING. ALSO, SINCE THE TRADES HAVE NOT BEEN EXECUTED, THE RESULTS MAY HAVE UNDER-OR-OVER COMPENSATED FOR THE IMPACT, IF ANY, OF CERTAIN MARKET FACTORS, SUCH AS LACK OF LIQUIDITY. SIMULATED TRADING PROGRAMS IN GENERAL ARE ALSO SUBJECT TO THE FACT THAT THEY ARE DESIGNED WITH THE BENEFIT OF HINDSIGHT. NO REPRESENTATION IS BEING MADE THAT ANY ACCOUNT WILL OR IS LIKELY TO ACHIEVE PROFIT OR LOSSES SIMILAR TO THOSE SHOWN