
Markets

US stocks came under heavy selling pressure Thursday as weak economic data and another sharp sell-off in chip stocks spurred losses across all three major indexes one day after the Federal Reserve signaled a likely rate cut in September.
The tech-heavy Nasdaq Composite (^IXIC) led losses, falling 2.3% after opening Thursday’s session in green figures.
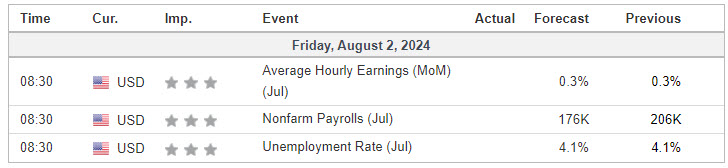
The next key data release will come on Friday, with the release of the July jobs report, which is expected to show the US economy added 175,000 jobs last month with the unemployment rate holding at 4.1%.
Source: Yahoo Finance
Economic Calendar
S&P 500

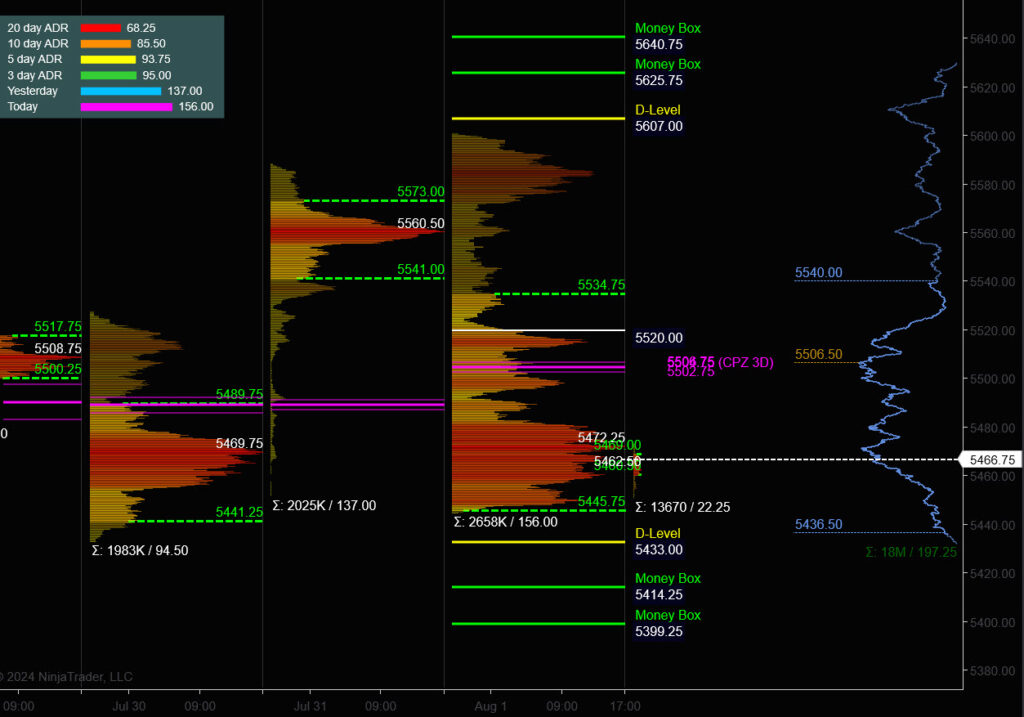
Prior Session was Cycle Day 2: MATD rhythms quickly turned negative on a Long Liquidation Break of the key 5560 handle, as sellers swamped buyers, pushing down to retest Key Cycle Day 1 Support Zone between 5445 – 5450. Range swelled to 156 handles which is 2x the 10 day average (85) on 2.658M contracts exchanged.
…Transition from Cycle Day 2 to Cycle Day 3
This leads us into Cycle Day 3: Momentum clearly favors sellers as today’s Jobs Report (see above) may add more fuel to the current “risk-off” sentiment. Any bounce at this stage should be viewed as a selling opportunity. Price will need to trade above the Cycle Day 1 Low (5451.50) to secure a positive three-day statistic (90%). Break lower targets 5425 – 5420 whereas bounce targets 5475 – 5480.
You Know The Plan! Our discipline of maintaining positioning that is aligned with market forces continues to serve us well, so stay the course.
As such, scenarios to consider for today’s trading.
Bull Scenario: Price sustains a bid above 5450, initially targets 5475 – 5480 zone.
Bear Scenario: Price sustains an offer below 5450, initially targets 5425 – 5420 zone.
PVA High Edge = 5535 PVA Low Edge = 5445 Prior POC = 5472
PTG 3 Day Cycle
EXCLUSIVE OFFER

*****The 3 Day Cycle has a 90% probability of fulfilling Positive Cycle Statistics covering 12 years of recorded tracking history.
ES Chart
Nasdaq 100 (NQ)

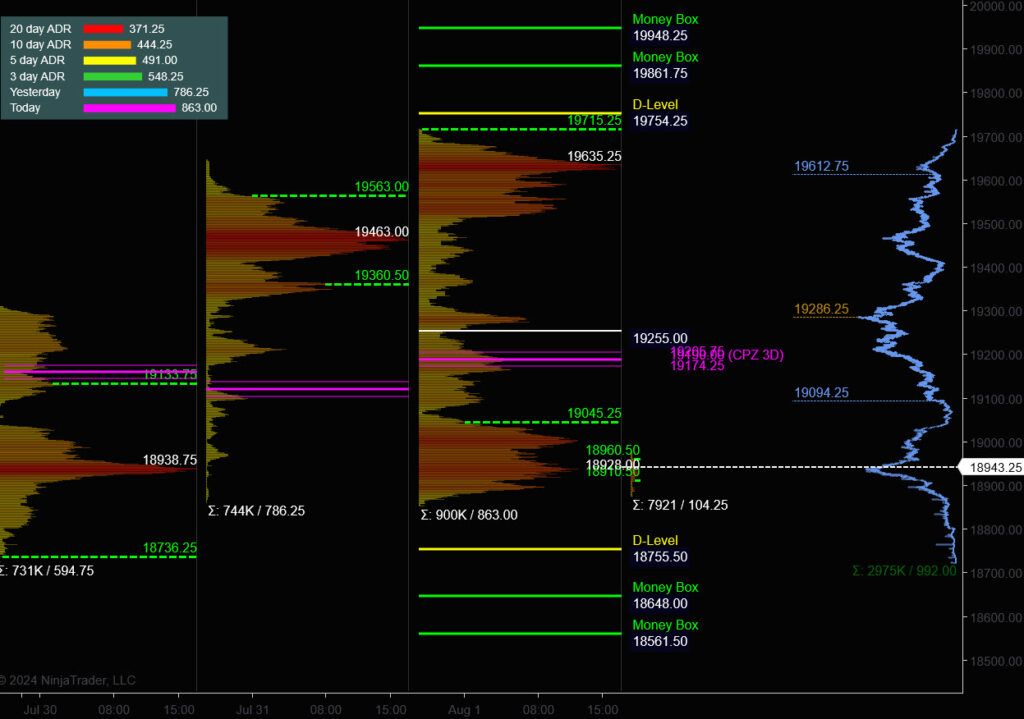
Prior Session was Cycle Day 2: MATD rhythms quickly turned negative on a Long Liquidation Break of the key 19500 handle, as sellers swamped buyers, pushing down to retest Key Cycle Day 1 Support 18862. Range swelled to 863 handles which is 2x the 10 day average (490) on 900k contracts exchanged.
…Transition from Cycle Day 2 to Cycle Day 3
This leads us into Cycle Day 3: Momentum clearly favors sellers as today’s Jobs Report (see above) may add more fuel to the current “risk-off” sentiment. Any bounce at this stage should be viewed as a selling opportunity. Price will need to trade above the Cycle Day 1 Low (18862) to secure a positive three-day statistic (90%). Break lower targets 18795 – 18756 whereas bounce targets 19185 – 19285.
You Know The Plan! Our discipline of maintaining positioning that is aligned with market forces continues to serve us well, so stay the course.
As such, scenarios to consider for today’s trading.
Bull Scenario: Price sustains a bid above 18935, initially targets 19185 – 19285 zone.
Bear Scenario: Price sustains an offer below 18935, initially targets 18795 – 18756 zone.
PVA High Edge = 19715 PVA Low Edge = 19045 Prior POC = 19285
NQ Chart
Trade Strategy: Our tactical trade strategy will simply remain unaltered…We’ll be flexible to trade both long and short side from Decision Pivot Levels. Continue to focus on Bull/Bear Stackers and Premium/Discounts. As always, remaining in alignment with dominant intra-day force increases probabilities of producing winning trades.
Stay Focused…Non-Biased…Disciplined ALWAYS USE STOPS!
Good Trading…David
“Knowing is not enough, We must APPLY. Willing is not enough, We must DO.” –BR
*****This trade strategy report is disseminated for “education only” and should not be viewed in any way as a recommendation to buy or sell futures products.”
PAST PERFORMANCE IS NOT NECESSARILY INDICATIVE OF FUTURE RESULTS
IMPORTANT NOTICE! No representation is being made that the use of this strategy or any system or trading methodology will generate profits. Past performance is not necessarily indicative of future results. There is substantial risk of loss associated with trading securities and options on equities. Only risk capital should be used to trade. Trading securities is not suitable for everyone.
Disclaimer: Futures, Options, and Currency trading all have large potential rewards, but they also have large potential risk. You must be aware of the risks and be willing to accept them in order to invest in these markets. Don’t trade with money you can’t afford to lose.
This website is neither a solicitation nor an offer to Buy/Sell futures, options, or currencies. No representation is being made that any account will or is likely to achieve profits or losses similar to those discussed on this web site. The past performance of any trading system or methodology is not necessarily indicative of future results.
CFTC RULE 4.41 –HYPOTHETICAL OR SIMULATED PERFORMANCE RESULTS HAVE CERTAIN LIMITATIONS. UNLIKE AN ACTUAL PERFORMANCE RECORD, SIMULATED RESULTS DO NOT REPRESENT ACTUAL TRADING. ALSO, SINCE THE TRADES HAVE NOT BEEN EXECUTED, THE RESULTS MAY HAVE UNDER-OR-OVER COMPENSATED FOR THE IMPACT, IF ANY, OF CERTAIN MARKET FACTORS, SUCH AS LACK OF LIQUIDITY. SIMULATED TRADING PROGRAMS IN GENERAL ARE ALSO SUBJECT TO THE FACT THAT THEY ARE DESIGNED WITH THE BENEFIT OF HINDSIGHT. NO REPRESENTATION IS BEING MADE THAT ANY ACCOUNT WILL OR IS LIKELY TO ACHIEVE PROFIT OR LOSSES SIMILAR TO THOSE SHOWN