
Markets

US stocks slid on Wednesday, failing to extend Tuesday’s rebound that snapped a three-day losing streak for the major averages.
Losses accelerated into the close as the benchmark S&P 500 (^GSPC) fell more than 0.8% and the tech-heavy Nasdaq Composite (^IXIC) slid 1.1%. The Dow Jones Industrial Average (^DJI) was off about 0.6%, or nearly 250 points. All three of the major averages had been up more than 1% at some point during the session.
Source: Seeking Alpha
Economic Calendar
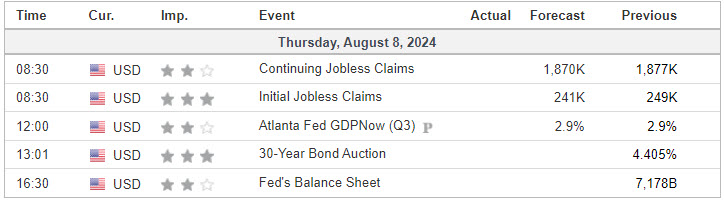
Source: Investing.com
S&P 500

Prior Session was Cycle Day 3: Positive Three-Day Super Cycle as volatility expanded the Average True Range (132), thereby overshooting historical normalized levels. There is a “built-in” self-adjusting calculation as new recent data will be added to cycle range targets.
Price rallied during the morning session fulfilling and exceeding upside range projections. But buyers were not able to sustain an adequate bid. Subsequent violation of the 5230 – 5240 Line in the Sand as outlined in prior DTS Briefing 8.7.24 forced long liquidation into the closing bell. Range was162 handles on 2.137M contracts exchanged.
…Transition from Cycle Day 3 to Cycle Day 1
This leads us into Cycle Day 1: Once again price has far exceeded the projected CD1 average decline, so we’ll defer to Mr. Market to establish a new cycle low from today’s session. Price closed on session lows, so we’ll be paying close attention if there is a “spill-over” or if buyers are in “bargain-hunting” mode.
Our discipline of maintaining positioning that is aligned with market forces continues to serve us well, so stay the course.
As such, scenarios to consider for today’s trading.
Bull Scenario: Price sustains a bid above 5195, initially targets 5225 – 5230 zone.
Bear Scenario: Price sustains an offer below 5195, initially targets 5180 – 5175 zone.
PVA High Edge = 5358 PVA Low Edge = 5258 Prior POC = 5278
PTG 3 Day Cycle
EXCLUSIVE OFFER

*****The 3 Day Cycle has a 90% probability of fulfilling Positive Cycle Statistics covering 12 years of recorded tracking history.
ES Chart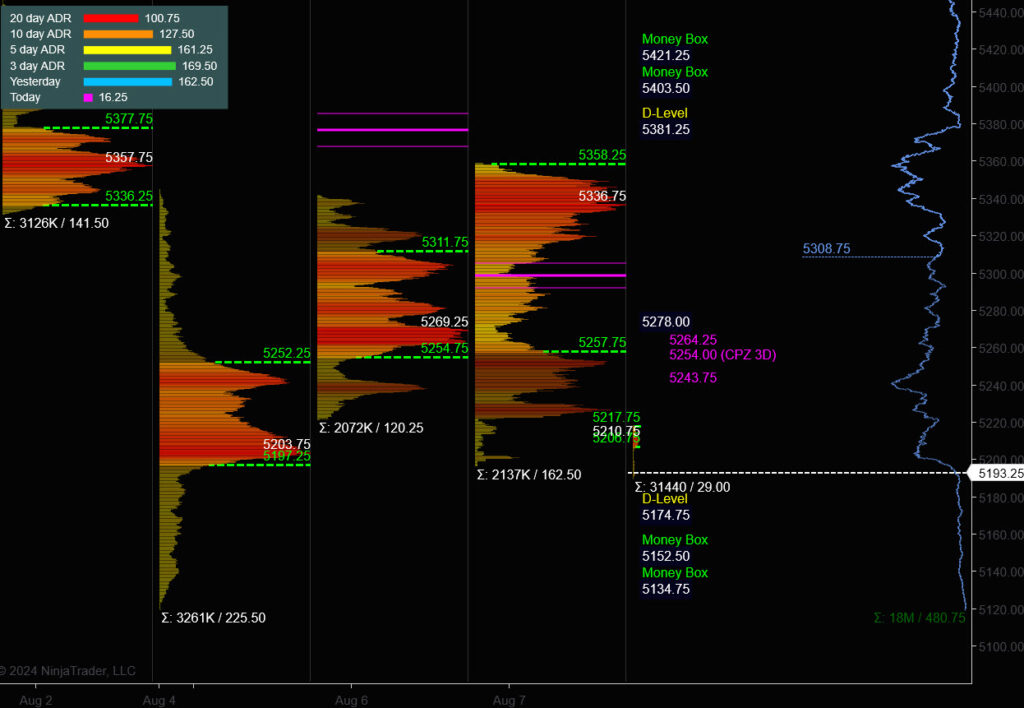
Nasdaq 100 (NQ)

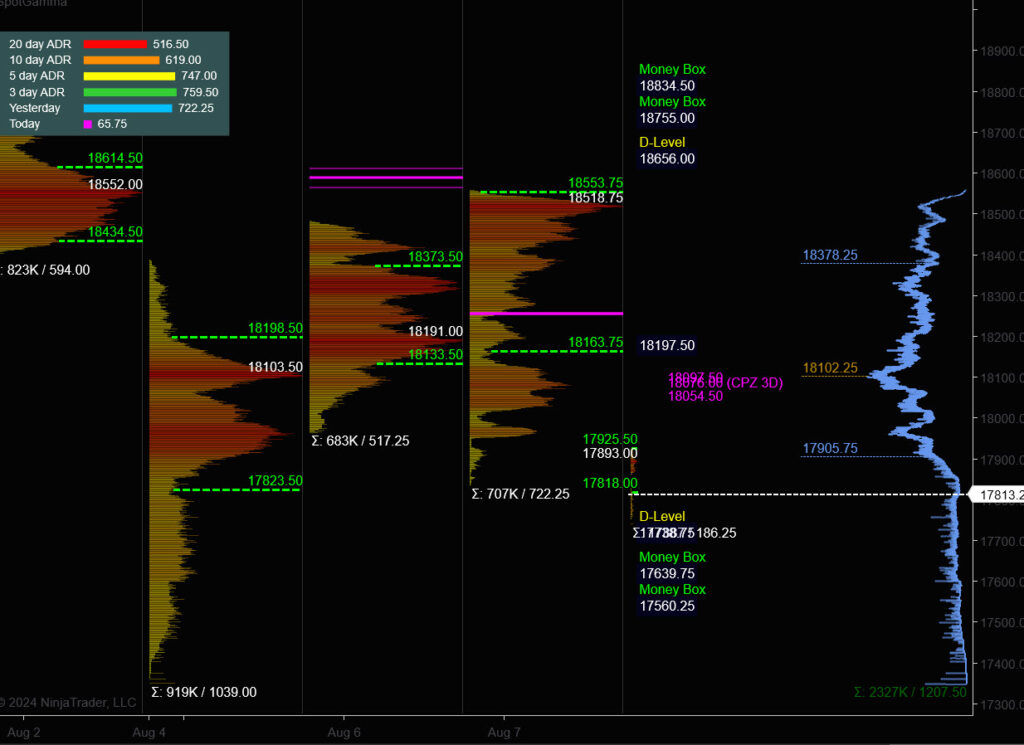
Prior Session was Cycle Day 3: Positive Three-Day Super Cycle as volatility expanded the Average True Range (640), thereby overshooting historical normalized levels. There is a “built-in” self-adjusting calculation as new recent data will be added to cycle range targets.
Price rallied during the morning session fulfilling and exceeding upside range projections. But buyers were not able to sustain an adequate bid. Subsequent violation of the 18100 Line in the Sand as outlined in prior DTS Briefing 8.7.24 forced long liquidation into the closing bell. Range was 722 handles on 707k contracts exchanged.
…Transition from Cycle Day 3 to Cycle Day 1
This leads us into Cycle Day 1: Once again price has far exceeded the projected CD1 average decline, so we’ll defer to Mr. Market to establish a new cycle low from today’s session. Price closed on session lows, so we’ll be paying close attention if there is a “spill-over” or if buyers are in “bargain-hunting” mode.
Our discipline of maintaining positioning that is aligned with market forces continues to serve us well, so stay the course.
As such, scenarios to consider for today’s trading.
Bull Scenario: Price sustains a bid above 17905, initially targets 18130 – 18195 zone.
Bear Scenario: Price sustains an offer below 17905, initially targets 17740 – 17700 zone.
PVA High Edge = 18554 PVA Low Edge = 18164 Prior POC = 18518
NQ Chart
Trade Strategy: Our tactical trade strategy will simply remain unaltered…We’ll be flexible to trade both long and short side from Decision Pivot Levels. Continue to focus on Bull/Bear Stackers and Premium/Discounts. As always, remaining in alignment with dominant intra-day force increases probabilities of producing winning trades.
Stay Focused…Non-Biased…Disciplined ALWAYS USE STOPS!
Good Trading…David
“Knowing is not enough, We must APPLY. Willing is not enough, We must DO.” –BR
*****This trade strategy report is disseminated for “education only” and should not be viewed in any way as a recommendation to buy or sell futures products.”
PAST PERFORMANCE IS NOT NECESSARILY INDICATIVE OF FUTURE RESULTS
IMPORTANT NOTICE! No representation is being made that the use of this strategy or any system or trading methodology will generate profits. Past performance is not necessarily indicative of future results. There is substantial risk of loss associated with trading securities and options on equities. Only risk capital should be used to trade. Trading securities is not suitable for everyone.
Disclaimer: Futures, Options, and Currency trading all have large potential rewards, but they also have large potential risk. You must be aware of the risks and be willing to accept them in order to invest in these markets. Don’t trade with money you can’t afford to lose.
This website is neither a solicitation nor an offer to Buy/Sell futures, options, or currencies. No representation is being made that any account will or is likely to achieve profits or losses similar to those discussed on this web site. The past performance of any trading system or methodology is not necessarily indicative of future results.
CFTC RULE 4.41 –HYPOTHETICAL OR SIMULATED PERFORMANCE RESULTS HAVE CERTAIN LIMITATIONS. UNLIKE AN ACTUAL PERFORMANCE RECORD, SIMULATED RESULTS DO NOT REPRESENT ACTUAL TRADING. ALSO, SINCE THE TRADES HAVE NOT BEEN EXECUTED, THE RESULTS MAY HAVE UNDER-OR-OVER COMPENSATED FOR THE IMPACT, IF ANY, OF CERTAIN MARKET FACTORS, SUCH AS LACK OF LIQUIDITY. SIMULATED TRADING PROGRAMS IN GENERAL ARE ALSO SUBJECT TO THE FACT THAT THEY ARE DESIGNED WITH THE BENEFIT OF HINDSIGHT. NO REPRESENTATION IS BEING MADE THAT ANY ACCOUNT WILL OR IS LIKELY TO ACHIEVE PROFIT OR LOSSES SIMILAR TO THOSE SHOWN