
S&P 500

Prior Session was Cycle Day 1: Textbook Cycle Day 1 (CD1) as price initially poked above PH (5665.25) but could not sustain an adequate bid. This condition set up the classic “Look Above and Fail” (a.k.a. “The Whiplash Trade“) reversal structure. Member Libby71 posted: ( “
Price continued the “sell-bias” throughout the session, fulfilling the CD1 Average Decline Target Zone (5630 – 5627). Buy Response from the Previous Week Midpoint marked the final Cycle Day 1 Low (5619.75). Range was 49 handles on 1.058M contracts exchanged.
*****Key component of the PTG Trading Methodology is identification of Price Structure Shifts and getting aligned in an efficient manner. Utilizing the tools that are outlined in the PTG Member’s Area Educational Media of the website is mandatory to improve your trading consistency.
…Transition from Cycle Day 1 to Cycle Day 2
This leads us into Cycle Day 2: As stated in the prior briefing, we believe the market is currently in a “consolidation/contraction” phase while it builds up ample energy for the next directional expansion. To reiterate, this week is a big “end of summer” vacation period for many traders/money-managers. So this week may have “thin-to-win” trading rhythms on lower volumes.
The BIG Event for this week is of course Nvidia (NVDA) earnings release on Wednesday with anticipation of having market-moving impact.
Being a Cycle Day 2 (CD2) normal expectation will be for balancing within the recent parameters. Levels of interest to the downside are: 5620 (prior weekly mid)…5595 (NVPOC). Levels of interest to the upside are: 5640…5645…5650
Our discipline of maintaining positioning that is aligned with market forces continues to serve us well, so stay the course.
As such, scenarios to consider for today’s trading.
Bull Scenario: Price sustains a bid above 5630, initially targets 5645 – 5650 zone.
Bear Scenario: Price sustains an offer below 5630, initially targets 5620 – 5615 zone.
PVA High Edge = 5627 PVA Low Edge = 5650 Prior POC = 5636
ES Chart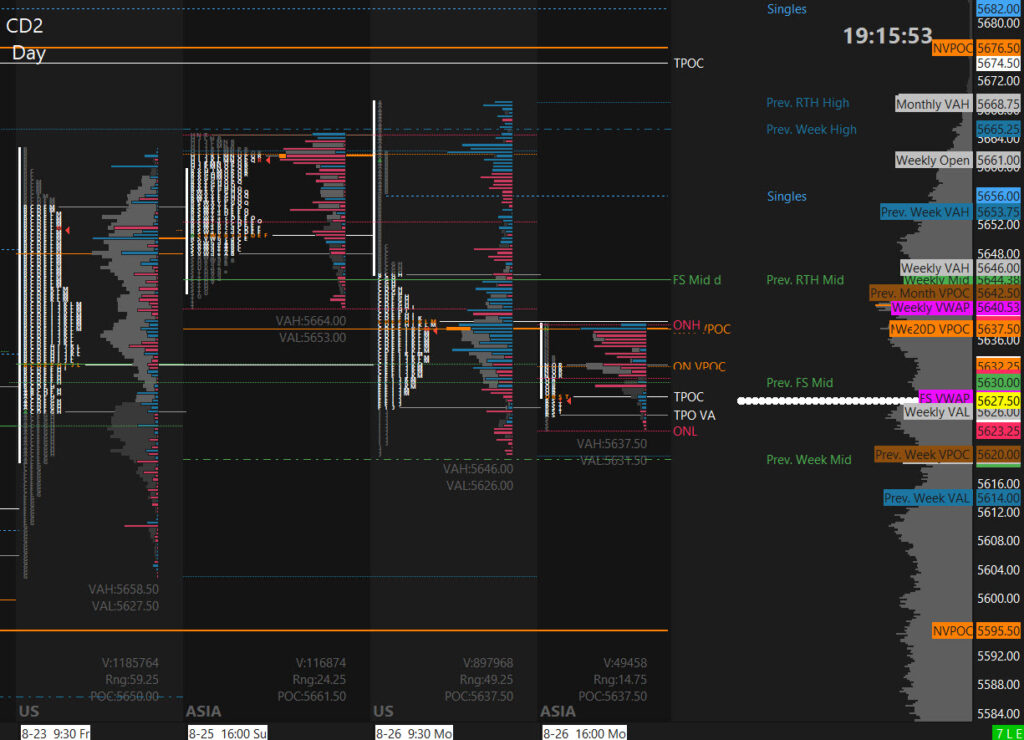
Nasdaq 100 (NQ)

Prior Session was Cycle Day 1: Opening Range Drive Lower set in motion this session’s “sell-bias”, as price fulfilled the Average Decline Target (19660 – 19576) in a textbook Cycle Day 1 normal. Range was 340 handles on 467k contracts exchanged.
…Transition from Cycle Day 1 to Cycle Day 2
This leads us into Cycle Day 2: Markets are in a “balancing-phase” following the past two-weeks V-Pattern volatility. Price has also traversed multiple levels both on the way down and back up, so we will defer to Mr. Market to guide us on which levels will be of key interest this week. Our daily plan remains unaltered. Select Triple A+++ trade setups with proper risk management.
Our discipline of maintaining positioning that is aligned with market forces continues to serve us well, so stay the course.
As such, scenarios to consider for today’s trading.
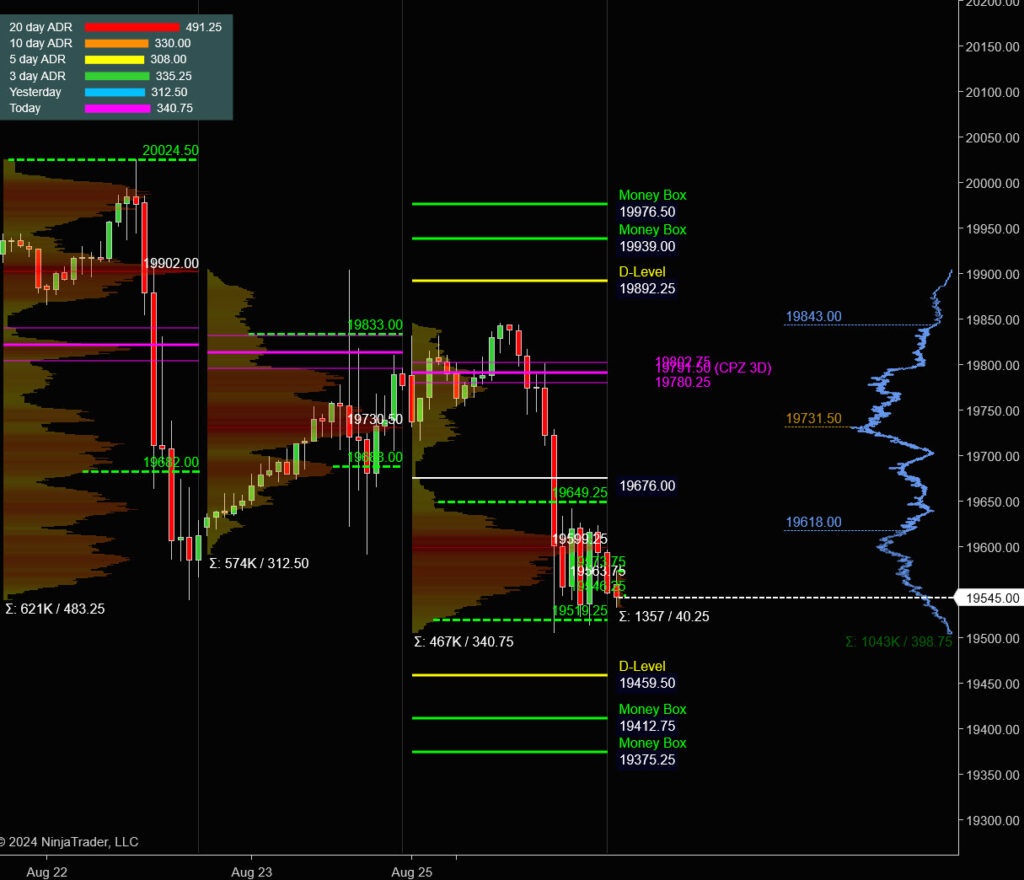
Bull Scenario: Price sustains a bid above 19550, initially targets 19615 – 19635 zone.
Bear Scenario: Price sustains an offer below 19550, initially targets 19505 – 19460 zone.
PVA High Edge = 19649 PVA Low Edge = 19519 Prior POC = 19599
NQ Chart
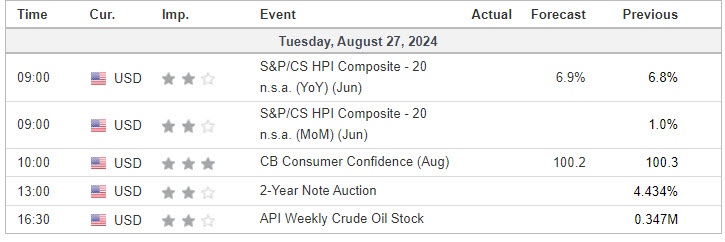
Economic Calendar
Trade Strategy: Our tactical trade strategy will simply remain unaltered…We’ll be flexible to trade both long and short side from Decision Pivot Levels. Continue to focus on Bull/Bear Stackers and Premium/Discounts. As always, remaining in alignment with dominant intra-day force increases probabilities of producing winning trades.
Stay Focused…Non-Biased…Disciplined ALWAYS USE STOPS!
Good Trading…David
“Knowing is not enough, We must APPLY. Willing is not enough, We must DO.” –BR
*****This trade strategy report is disseminated for “education only” and should not be viewed in any way as a recommendation to buy or sell futures products.”
PAST PERFORMANCE IS NOT NECESSARILY INDICATIVE OF FUTURE RESULTS
IMPORTANT NOTICE! No representation is being made that the use of this strategy or any system or trading methodology will generate profits. Past performance is not necessarily indicative of future results. There is substantial risk of loss associated with trading securities and options on equities. Only risk capital should be used to trade. Trading securities is not suitable for everyone.
Disclaimer: Futures, Options, and Currency trading all have large potential rewards, but they also have large potential risk. You must be aware of the risks and be willing to accept them in order to invest in these markets. Don’t trade with money you can’t afford to lose.
This website is neither a solicitation nor an offer to Buy/Sell futures, options, or currencies. No representation is being made that any account will or is likely to achieve profits or losses similar to those discussed on this web site. The past performance of any trading system or methodology is not necessarily indicative of future results.
CFTC RULE 4.41 –HYPOTHETICAL OR SIMULATED PERFORMANCE RESULTS HAVE CERTAIN LIMITATIONS. UNLIKE AN ACTUAL PERFORMANCE RECORD, SIMULATED RESULTS DO NOT REPRESENT ACTUAL TRADING. ALSO, SINCE THE TRADES HAVE NOT BEEN EXECUTED, THE RESULTS MAY HAVE UNDER-OR-OVER COMPENSATED FOR THE IMPACT, IF ANY, OF CERTAIN MARKET FACTORS, SUCH AS LACK OF LIQUIDITY. SIMULATED TRADING PROGRAMS IN GENERAL ARE ALSO SUBJECT TO THE FACT THAT THEY ARE DESIGNED WITH THE BENEFIT OF HINDSIGHT. NO REPRESENTATION IS BEING MADE THAT ANY ACCOUNT WILL OR IS LIKELY TO ACHIEVE PROFIT OR LOSSES SIMILAR TO THOSE SHOWN