
S&P 500

Prior Session was Cycle Day 2: We knew there was a Time & Price Low window as outlined in prior DTS Briefing 9.9.24 which triggered today. Price reclaimed our Line in the Sand (LIS) 5415 Buy Signal early in GLOBEX which sparked a session long rally fulfilling 5486.50 3 Day Cycle Target. Range was 87 handles on 1.518M contracts exchanged.
…Transition from Cycle Day 2 to Cycle Day 3
This leads us into Cycle Day 3: Price has fulfilled the 3 Day Cycle Target (5486.50) with bulls in-control. Momentum may spill over into todays session pushing for higher levels above 5500 – 5510 zone. Bears would need a break below (5460) to force bulls hands.
Our discipline of maintaining positioning that is aligned with market forces continues to serve us well, so stay the course.
As such, scenarios to consider for today’s trading.
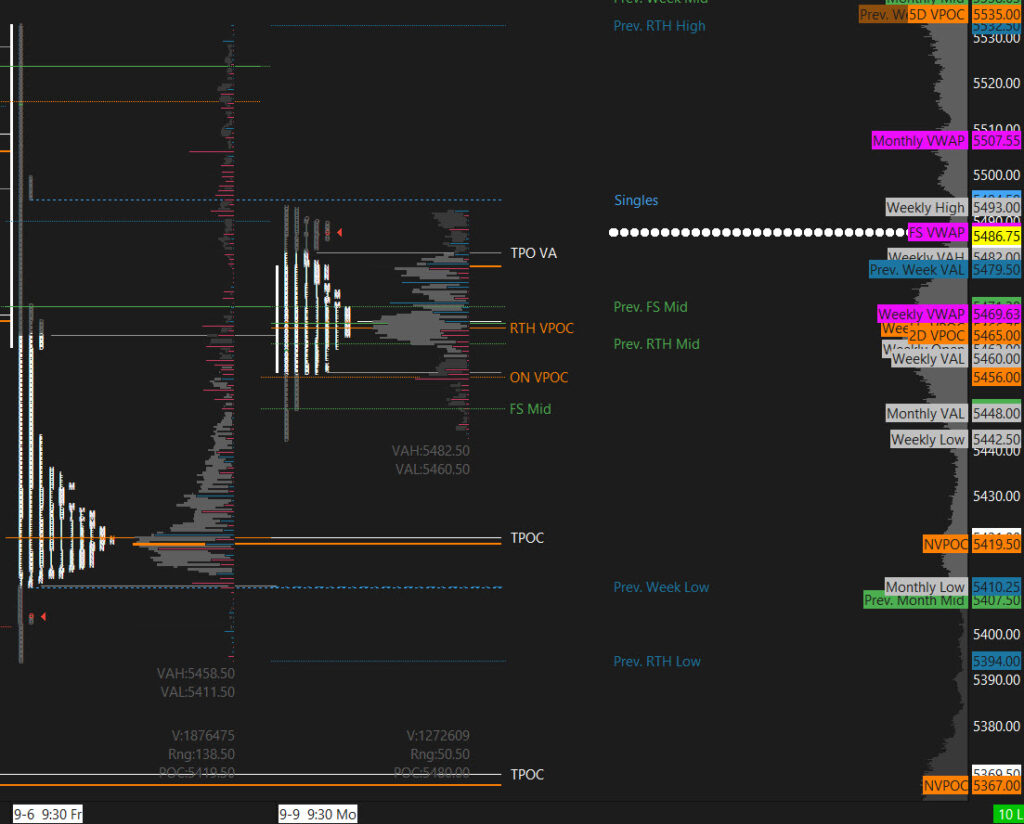
Bull Scenario: Price sustains a bid above 5480, initially targets 5495 – 5505 zone.
Bear Scenario: Price sustains an offer below 5480, initially targets 5465 – 5460 zone.
PVA High Edge = 5482 PVA Low Edge = 5456 Prior POC = 5467
ES Chart
Nasdaq 100 (NQ)

Prior Session was Cycle Day 2: We knew there was a Time & Price Low window as outlined in prior DTS Briefing 9.9.24 which triggered today. Price reclaimed our Line in the Sand (LIS) 18400 Buy Signal early in GLOBEX which sparked a session long rally closing just off high of the day 18734.50. Range was 348 handles on 524k contracts exchanged.
…Transition from Cycle Day 2 to Cycle Day 3
This leads us into Cycle Day 3: 3 Day Cycle Target (18777) is within striking distance of fulfillment with bulls in-control. Momentum may spill over into todays session pushing for higher levels above prior high. Bears would need a break below (18565) to force bulls hands.
Our discipline of maintaining positioning that is aligned with market forces continues to serve us well, so stay the course.
As such, scenarios to consider for today’s trading.
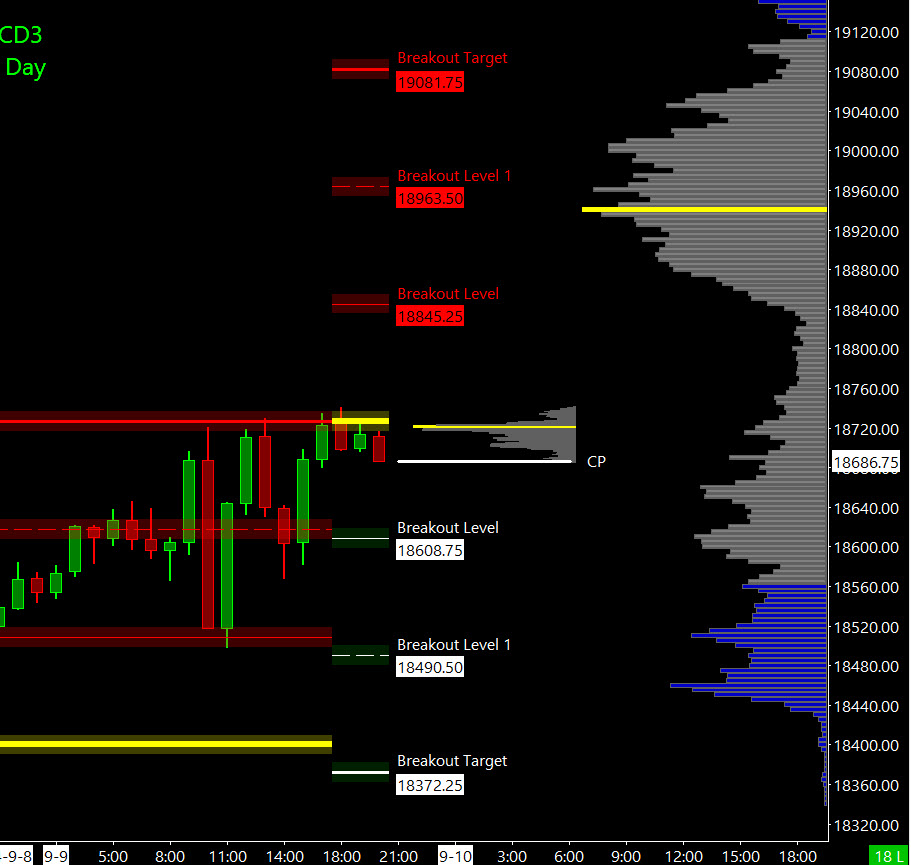
Bull Scenario: Price sustains a bid above 18725, initially targets 18780 – 18830 zone.
Bear Scenario: Price sustains an offer below 18725, initially targets 18605 – 18580 zone.
PVA High Edge = 18700 PVA Low Edge = 18580 Prior POC = 18605
NQ Chart
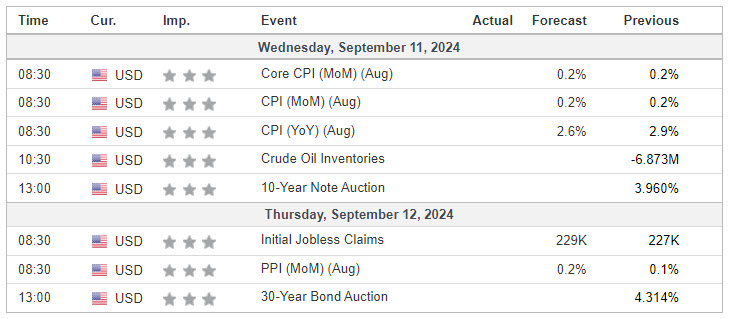
Economic Calendar
Trade Strategy: Our tactical trade strategy will simply remain unaltered…We’ll be flexible to trade both long and short side from Decision Pivot Levels. Continue to focus on Bull/Bear Stackers and Premium/Discounts. As always, remaining in alignment with dominant intra-day force increases probabilities of producing winning trades.
Stay Focused…Non-Biased…Disciplined ALWAYS USE STOPS!
Good Trading…David
“Knowing is not enough, We must APPLY. Willing is not enough, We must DO.” –BR
*****This trade strategy report is disseminated for “education only” and should not be viewed in any way as a recommendation to buy or sell futures products.”
PAST PERFORMANCE IS NOT NECESSARILY INDICATIVE OF FUTURE RESULTS
IMPORTANT NOTICE! No representation is being made that the use of this strategy or any system or trading methodology will generate profits. Past performance is not necessarily indicative of future results. There is substantial risk of loss associated with trading securities and options on equities. Only risk capital should be used to trade. Trading securities is not suitable for everyone.
Disclaimer: Futures, Options, and Currency trading all have large potential rewards, but they also have large potential risk. You must be aware of the risks and be willing to accept them in order to invest in these markets. Don’t trade with money you can’t afford to lose.
This website is neither a solicitation nor an offer to Buy/Sell futures, options, or currencies. No representation is being made that any account will or is likely to achieve profits or losses similar to those discussed on this web site. The past performance of any trading system or methodology is not necessarily indicative of future results.
CFTC RULE 4.41 –HYPOTHETICAL OR SIMULATED PERFORMANCE RESULTS HAVE CERTAIN LIMITATIONS. UNLIKE AN ACTUAL PERFORMANCE RECORD, SIMULATED RESULTS DO NOT REPRESENT ACTUAL TRADING. ALSO, SINCE THE TRADES HAVE NOT BEEN EXECUTED, THE RESULTS MAY HAVE UNDER-OR-OVER COMPENSATED FOR THE IMPACT, IF ANY, OF CERTAIN MARKET FACTORS, SUCH AS LACK OF LIQUIDITY. SIMULATED TRADING PROGRAMS IN GENERAL ARE ALSO SUBJECT TO THE FACT THAT THEY ARE DESIGNED WITH THE BENEFIT OF HINDSIGHT. NO REPRESENTATION IS BEING MADE THAT ANY ACCOUNT WILL OR IS LIKELY TO ACHIEVE PROFIT OR LOSSES SIMILAR TO THOSE SHOWN