
S&P 500

Important Note: We have begun publishing the PTG Trading Room Daily RECAP which you should be receiving at the end of each trading day. This publication is a more detailed review of how the trading unfolded throughout the day from our viewpoint. It is an “educational” complimentary companion to be used in conjunction with the Daily Trade Strategy. It continues to be “work-in-progress”, so please offer feedback as to content, style and relevance. We are always striving to make PTG Products and Services the very best
Prior Session was Cycle Day 2: Normal CD2 as price attempted an upside breakout and was rejected, continuing the “coiling” consolidation. Range was 31 handles on 973k contracts exchanged.
For a more detailed recap of prior trading session click on this link: Trading Room RECAP 9.25.24
…Transition from Cycle Day 2 to Cycle Day 3
This leads us into Cycle Day 3: Value continues it’s migration higher during this “coiling” consolidation phase, which by conventional wisdom favors an upside resolution and continuation of the uptrend. No significant change from yesterday’s briefing, as the same levels remain for today’s session.
Key pivot (5770) is a critical hold on any pullback within multi-day range. Ideally, for continuation breakout higher, price should hold above 5785 – 5795 zone with fresh new aggressive buying volumes. So we will remain patient and vigilant for the proper structural conditions to support retest of All-Time Highs.
Typically markets ebb n flow from Contractionary to Expansionary periods. The next expansionary phase will develop, so we need to be prepared for when it does. I have noted some level ideas for the next expansion, which is meant to be an overview guide.
Expansion Trigger Level?
The key level to watch for an expansion trigger would be 5785 – 5795 zone on the upside. This was noted as a resistance zone that bulls have struggled to clear.
If price action breaks above 5785 – 5795 and holds, it could act as a trigger for expansion and a potential rally to higher levels, with multiple upside targets staggered between 5800-5820 or higher, depending on momentum.
On the downside, if price breaks below 5755 – 5745 zone, which is the lower boundary of larger range, it could trigger a downward expansion, with potential targets between 5720-5700.
So, the critical trigger levels for expansion:
- Upside: Break and hold above 5785 – 5795 Zone.
- Downside: Break below 5755 – 5745 zone
Our discipline of maintaining positioning that is aligned with market forces continues to serve us well, so stay the course.
As such, scenarios to consider for today’s trading.
Bull Scenario: Price sustains a bid above 5775, initially targets 5785 – 5795 zone.
Bear Scenario: Price sustains an offer below 5775, initially targets 5765 – 5760 zone.
PVA High Edge = 5797 PVA Low Edge = 5780 Prior POC = 5790
ES Chart (Multi-Day Composite Profile)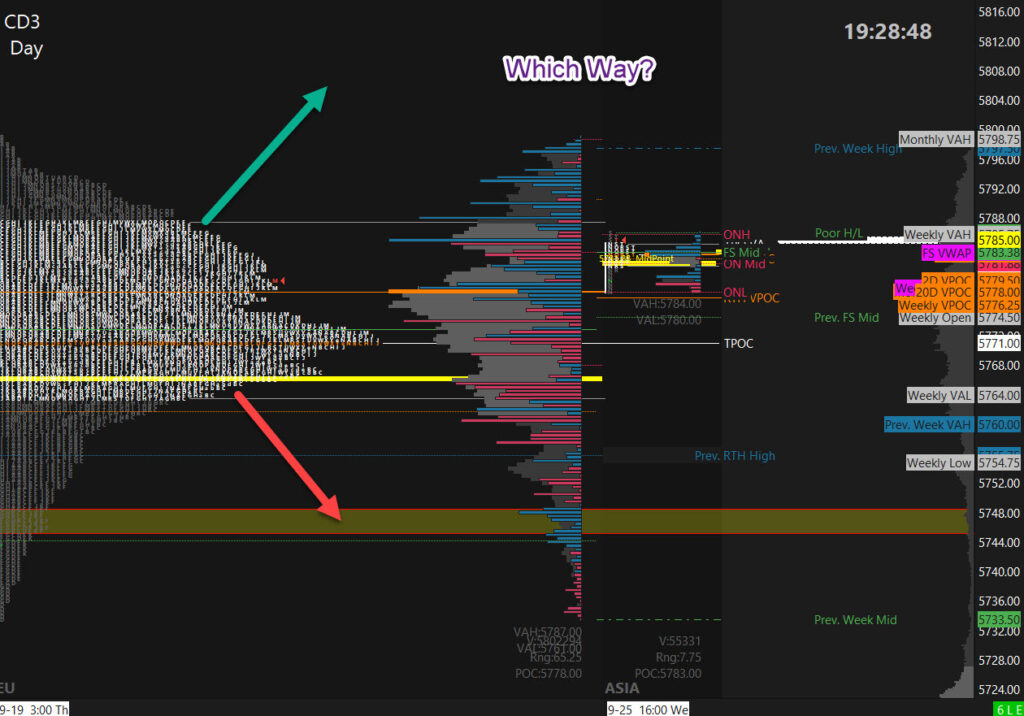
Nasdaq 100 (NQ)

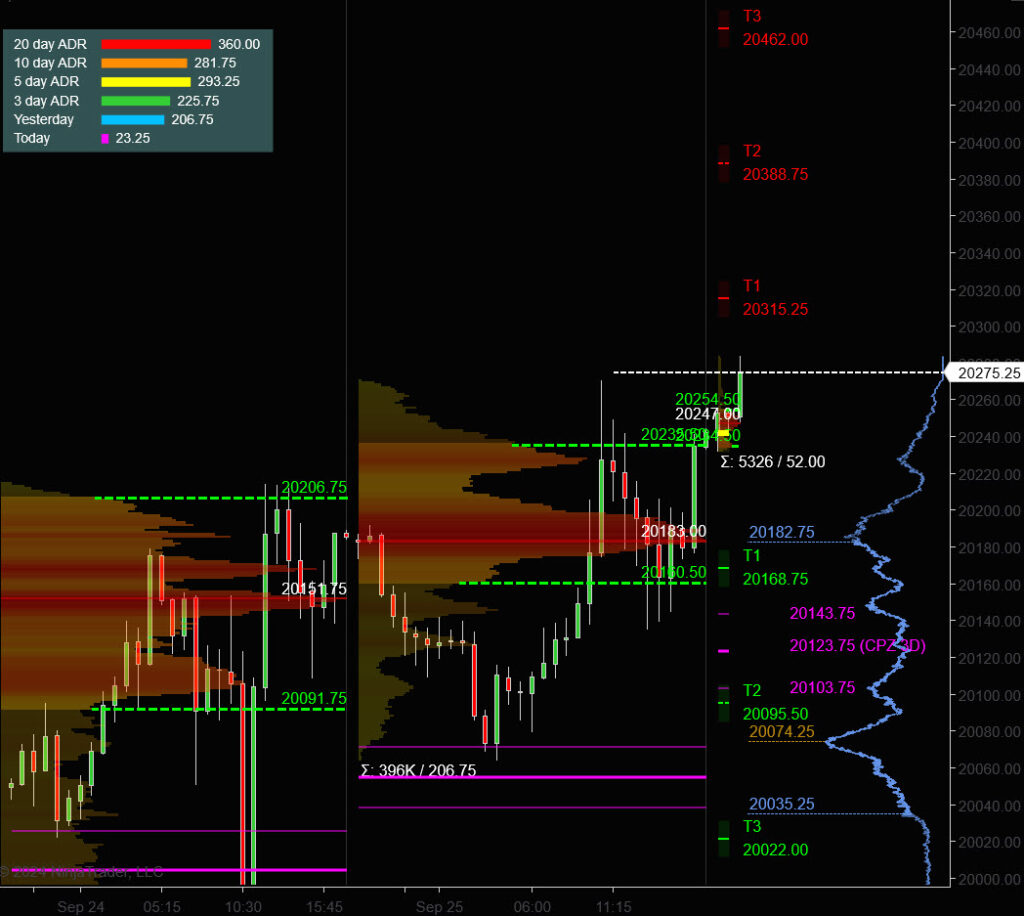
Prior Session was Cycle Day 2: Normal CD2 as price consolidated albeit at a higher level, indicating relative Strength (RS) versus the ES which failed its breakout attempt. Overall the market continues in a now 5-day “coiling” consolidation phase as traders await a definitive directional signal. Range was 207 handles on 396k contracts exchanged.
For a more detailed recap of prior trading session click on this link: Trading Room RECAP 9.25.24
…Transition from Cycle Day 3 to Cycle Day 3
This leads us into Cycle Day 3: Primary cycle objective (20104.50) has been fulfilled with a positive 3-day cycle statistic fulfilled. Though further upside cycle targets remain unfulfilled, so potential exists for upside resolution to the current stalemate. We will reference prior VAH (20235) as today’s Line in the Sand (LIS) As always, we will let Mr. Market be our trading tour-guide for directional breakout.
Our discipline of maintaining positioning that is aligned with market forces continues to serve us well, so stay the course.
As such, scenarios to consider for today’s trading.
Bull Scenario: Price sustains a bid above 20235, initially targets 20290 – 20315 zone.
Bear Scenario: Price sustains an offer below 20235, initially targets 20205 – 20190 zone.
PVA High Edge = 20235 PVA Low Edge = 20160 Prior POC = 20183
NQ Chart (Profile)
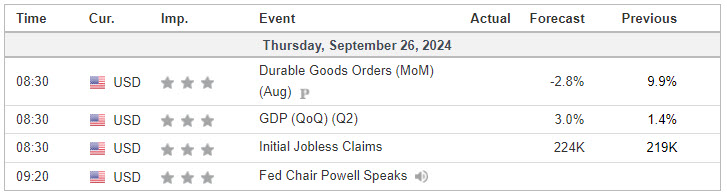
Economic Calendar
Trade Strategy: Our tactical trade strategy will simply remain unaltered…We’ll be flexible to trade both long and short side from Decision Pivot Levels. Continue to focus on Bull/Bear Stackers and Premium/Discounts. As always, remaining in alignment with dominant intra-day force increases probabilities of producing winning trades.
Stay Focused…Non-Biased…Disciplined ALWAYS USE STOPS!
Good Trading…David
“Knowing is not enough, We must APPLY. Willing is not enough, We must DO.” –BR
*****This trade strategy report is disseminated for “education only” and should not be viewed in any way as a recommendation to buy or sell futures products.”
PAST PERFORMANCE IS NOT NECESSARILY INDICATIVE OF FUTURE RESULTS
IMPORTANT NOTICE! No representation is being made that the use of this strategy or any system or trading methodology will generate profits. Past performance is not necessarily indicative of future results. There is substantial risk of loss associated with trading securities and options on equities. Only risk capital should be used to trade. Trading securities is not suitable for everyone.
Disclaimer: Futures, Options, and Currency trading all have large potential rewards, but they also have large potential risk. You must be aware of the risks and be willing to accept them in order to invest in these markets. Don’t trade with money you can’t afford to lose.
This website is neither a solicitation nor an offer to Buy/Sell futures, options, or currencies. No representation is being made that any account will or is likely to achieve profits or losses similar to those discussed on this web site. The past performance of any trading system or methodology is not necessarily indicative of future results.
CFTC RULE 4.41 –HYPOTHETICAL OR SIMULATED PERFORMANCE RESULTS HAVE CERTAIN LIMITATIONS. UNLIKE AN ACTUAL PERFORMANCE RECORD, SIMULATED RESULTS DO NOT REPRESENT ACTUAL TRADING. ALSO, SINCE THE TRADES HAVE NOT BEEN EXECUTED, THE RESULTS MAY HAVE UNDER-OR-OVER COMPENSATED FOR THE IMPACT, IF ANY, OF CERTAIN MARKET FACTORS, SUCH AS LACK OF LIQUIDITY. SIMULATED TRADING PROGRAMS IN GENERAL ARE ALSO SUBJECT TO THE FACT THAT THEY ARE DESIGNED WITH THE BENEFIT OF HINDSIGHT. NO REPRESENTATION IS BEING MADE THAT ANY ACCOUNT WILL OR IS LIKELY TO ACHIEVE PROFIT OR LOSSES SIMILAR TO THOSE SHOWN