
S&P 500

Here are three potential market context scenarios, factoring in the impact of the Non-Farm Payrolls (NFP) report and how it could influence the broader trading dynamics around today’s key levels:
1. Stronger-than-Expected NFP Report (Bullish Context)
Market Context: A stronger-than-expected NFP report indicates a robust labor market and supports the outlook for continued economic growth. This would be seen as bullish for equities, especially if traders believe it implies a stable or controlled inflation outlook.
- Price Action: In this scenario, the market is likely to react positively, with buyers stepping in. Expect a break above your LIS (5760-5770) as bulls attempt to convert that zone into support.
- Bull Scenario: Sustained price above the 5760-5770 zone targets 5785-5790, with the potential for further upside if the market shifts into risk-on mode. If buying momentum persists, we could see attempts at new highs, as long as volume supports the move.
- Bear Risk: A stronger NFP could initially cause volatility, but if buyers struggle to hold above the LIS zone, and the price falls back below 5760, it could lead to a “false breakout.” Watch for signs of exhaustion if this happens.
2. Weaker-than-Expected NFP Report (Bearish Context)
Market Context: A weaker-than-expected NFP report would signal a slowing labor market, potentially increasing concerns over economic growth. This would weigh on equities, pushing prices lower, especially if it sparks fears of recession.
- Price Action: If the NFP report disappoints, expect sellers to take control, pressing prices below 5730-5740. The market could break down further as risk-off sentiment dominates, with traders moving towards safer assets.
- Bear Scenario: Sustained price below the 5730 zone could lead to increased selling pressure, targeting 5717-5710. If liquidation continues, you might see further downside momentum, especially if global factors like rising geopolitical risks exacerbate the situation.
- Bull Risk: Even in a weak NFP scenario, watch for any sharp intraday reversal. Sometimes, a weak report can lead to speculation of future policy easing (like rate cuts), which could attract buyers. If price quickly reverses after testing 5730-5740, it could be a trap for aggressive shorts.
3. In-Line NFP Report (Neutral-to-Slightly Bullish)
Market Context: An in-line report that meets market expectations is likely to cause less volatility compared to an extreme surprise. Traders may interpret it as confirmation of a “steady as she goes” economy.
- Price Action: Initially, we may see a continuation of consolidation around the LIS (5760-5770) as traders assess the impact of the report. The battle between bulls and bears could intensify, with no clear direction in the immediate aftermath of the data.
- Bull Scenario: If buyers manage to break the LIS (5760-5770), sustained trade above this zone targets 5785-5790, but the move could be more gradual compared to a stronger report. Volume confirmation is key here.
- Bear Scenario: Should price fall below the 5730-5740 support, sellers could target 5717-5710. However, without an extreme catalyst, the downside might be limited unless other factors come into play (e.g., geopolitical tensions, unexpected Fed comments).
- Neutral Scenario: Prices could oscillate within the 5760-5730 zone if there is no clear directional driver post-NFP. This would likely mean another day of consolidation with two-way trade and potential fading of key levels as the market waits for more clarity in the days ahead.
Key Considerations for Today:
- Volume: Watch for sharp spikes in volume that confirm breakouts or breakdowns, especially after the NFP release.
- Geopolitical Tensions: Any escalation in overseas conflicts, particularly in the Middle East, could amplify the impact of the NFP report.
- Market Sentiment: Sentiment may shift quickly after the initial reaction to the report, so being adaptable to changes in price action is key.
These scenarios will help you stay prepared for how the market might respond post-NFP and guide your next steps based on the key zones.
*****Our discipline of maintaining positioning that is aligned with market forces continues to serve us well, so stay the course.
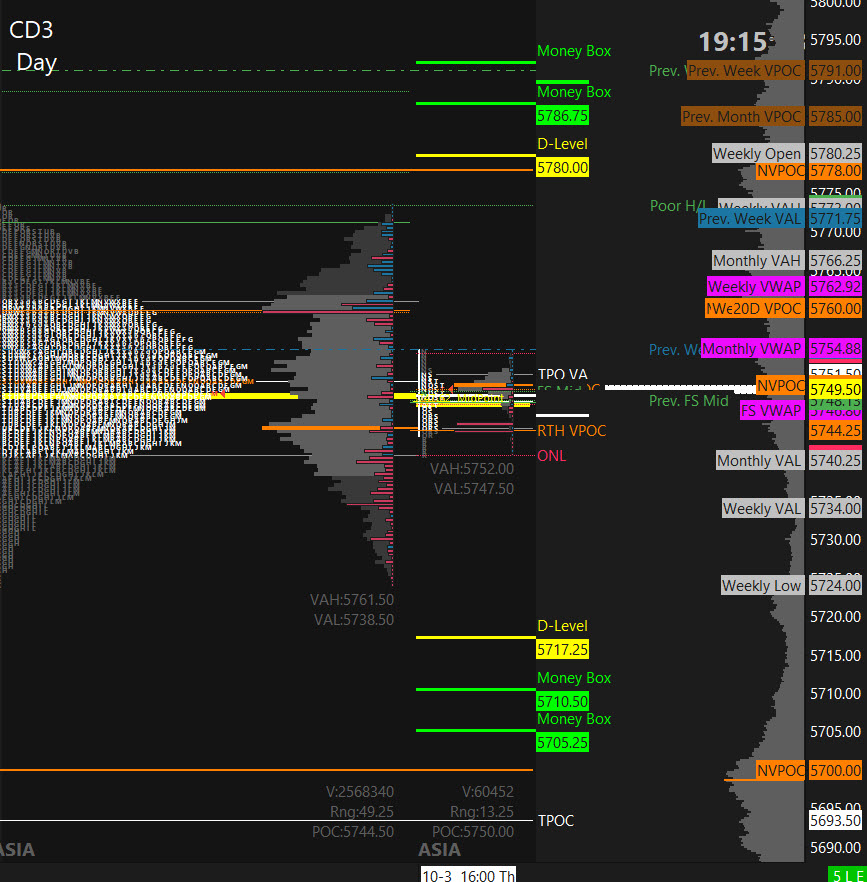
PVA High Edge = 5754 PVA Low Edge = 5736 Prior POC = 5741
ES Chart (Profile + D-Level Money Box)
Nasdaq 100 (NQ)

Prior Session was Cycle Day 2: Normal CD2 as price continued with “balancing” two-way trade supported at the 19875 – 19900 lower zone and resisted at 20050 – 20090 Line in the Sand (LIS) as outlined in prior DTS Briefing 10.3.24. Range was 261 handles on 521k contracts exchanged.
For a more detailed recap of the trading session, click on this link: Trading Room RECAP 10.3.24
…Transition from Cycle Day 2 to Cycle Day 3
The transition to Cycle Day 3 Positive Three-Day Cycle Statistic (92%) will be filled as long as price trades above the 19833.50 CD1 Low during RTH Session. Markets have been tightly consolidating in-advance of today’s BIG Non-Farm Payrolls (Jobs) Report which could act as a catalyst to break the current ever-tightening consolidation.
Our discipline of maintaining positioning that is aligned with market forces continues to serve us well, so stay the course.
As such, scenarios to consider for today’s trading.
Bull Scenario: Price sustains a bid above 20050, initially targets 20149– 20185 zone.
Bear Scenario: Price sustains an offer below 19875, initially targets 19817 – 19780 zone.
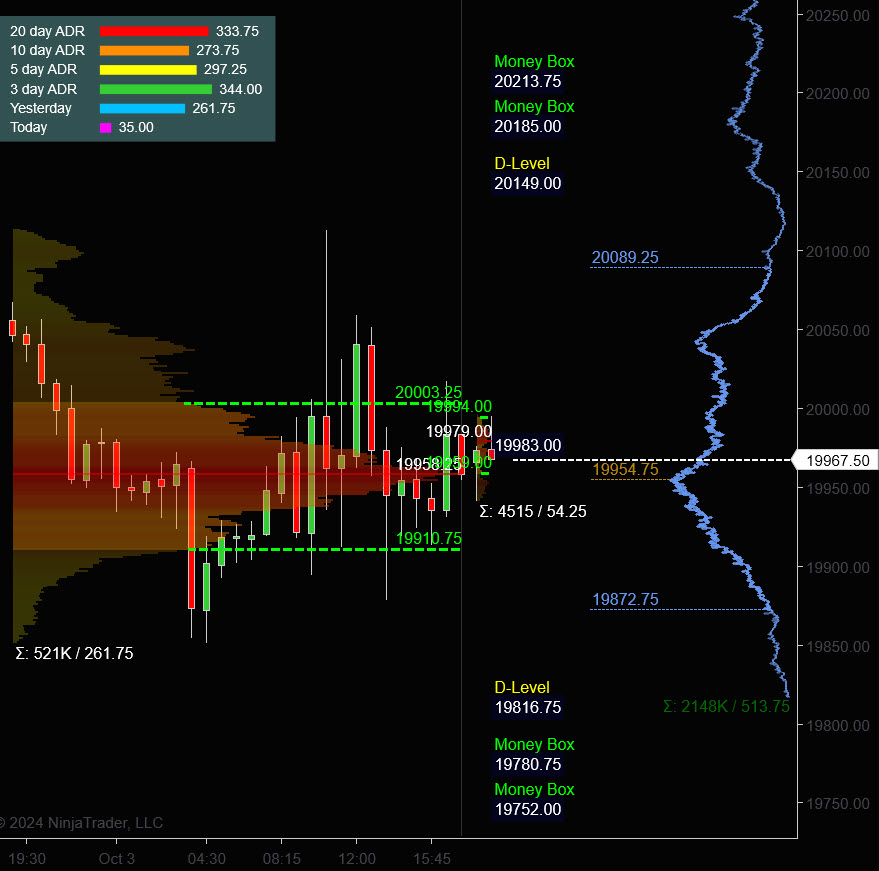
PVA High Edge = 20004 PVA Low Edge = 19910 Prior POC = 19958
NQ Chart (Profile)
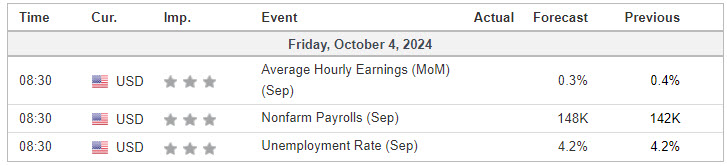
Economic Calendar
Trade Strategy: Our tactical trade strategy will simply remain unaltered…We’ll be flexible to trade both long and short side from Decision Pivot Levels. Continue to focus on Bull/Bear Stackers and Premium/Discounts. As always, remaining in alignment with dominant intra-day force increases probabilities of producing winning trades.
Stay Focused…Non-Biased…Disciplined ALWAYS USE STOPS!
Good Trading…David
“Knowing is not enough, We must APPLY. Willing is not enough, We must DO.” –BR
*****This trade strategy report is disseminated for “education only” and should not be viewed in any way as a recommendation to buy or sell futures products.”
PAST PERFORMANCE IS NOT NECESSARILY INDICATIVE OF FUTURE RESULTS
IMPORTANT NOTICE! No representation is being made that the use of this strategy or any system or trading methodology will generate profits. Past performance is not necessarily indicative of future results. There is substantial risk of loss associated with trading securities and options on equities. Only risk capital should be used to trade. Trading securities is not suitable for everyone.
Disclaimer: Futures, Options, and Currency trading all have large potential rewards, but they also have large potential risk. You must be aware of the risks and be willing to accept them in order to invest in these markets. Don’t trade with money you can’t afford to lose.
This website is neither a solicitation nor an offer to Buy/Sell futures, options, or currencies. No representation is being made that any account will or is likely to achieve profits or losses similar to those discussed on this web site. The past performance of any trading system or methodology is not necessarily indicative of future results.
CFTC RULE 4.41 –HYPOTHETICAL OR SIMULATED PERFORMANCE RESULTS HAVE CERTAIN LIMITATIONS. UNLIKE AN ACTUAL PERFORMANCE RECORD, SIMULATED RESULTS DO NOT REPRESENT ACTUAL TRADING. ALSO, SINCE THE TRADES HAVE NOT BEEN EXECUTED, THE RESULTS MAY HAVE UNDER-OR-OVER COMPENSATED FOR THE IMPACT, IF ANY, OF CERTAIN MARKET FACTORS, SUCH AS LACK OF LIQUIDITY. SIMULATED TRADING PROGRAMS IN GENERAL ARE ALSO SUBJECT TO THE FACT THAT THEY ARE DESIGNED WITH THE BENEFIT OF HINDSIGHT. NO REPRESENTATION IS BEING MADE THAT ANY ACCOUNT WILL OR IS LIKELY TO ACHIEVE PROFIT OR LOSSES SIMILAR TO THOSE SHOWN