
S&P 500

Prior Session was Cycle Day 3: Markets completed the prior week fulfilling the Three-Day Cycle Statistic, which stands at 92.42% accuracy. Check out the link to learn more about the Taylor Cycle and secure your FREE TRIAL. 
Markets are entering a full two-weeks of broad consolidation between 5725 – 5820. Breakout attempts have been mired with unsustainable bids as longs continue to lose any upside traction, which has resulted in a more broadening consolidation covering the past two-weeks. Though near all-time highs, bulls need multiple follow-through sessions to reach “escape velocity.” Prior range was 63 handles on 1.375M contracts exchanged.
For a more detailed recap of the trading session, click on this link: Trading Room RECAP 10.4.24
…Transition from Cycle Day 3 to Cycle Day 1
Transition into Cycle Day 1: The market’s bullish momentum could drive prices higher before the typical CD1 decline begins. Holding above the 5795-5800 zone will be crucial for bulls to maintain their edge, and if sustained, this could lead to a retest of the all-time highs.
The structural development of value shifting higher is a positive sign for the bulls. However, if price reverses below 5795, it would open up a potential downside move, first testing the 5785-5775 zone, and then potentially heading toward the prior session’s low near 5750.
Our discipline of maintaining positioning that is aligned with market forces continues to serve us well, so stay the course.
As such, scenarios to consider for today’s trading.
Bull Scenario: Price sustains a bid above 5795, initially targets 5815 – 5820 zone.
Bear Scenario: Price sustains an offer below 5795, initially targets 5775 – 5770 zone.
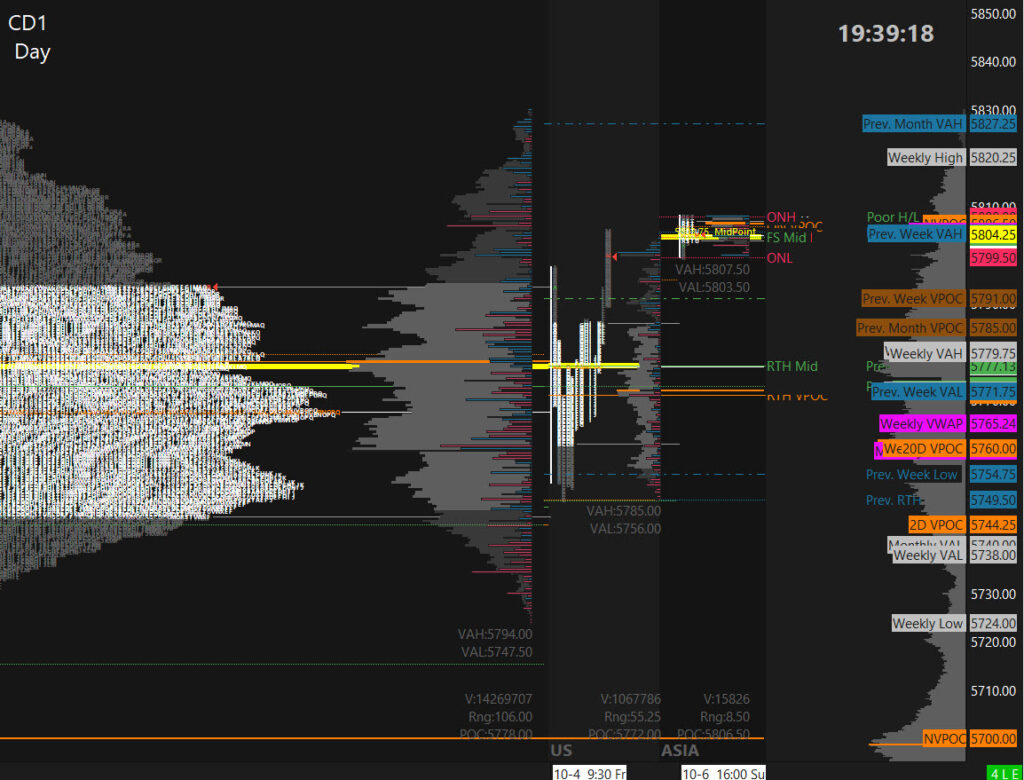
PVA High Edge = 5786 PVA Low Edge = 5752 Prior POC = 5775
ES Chart (Multi-Day Composite Profile)
Nasdaq 100 (NQ)

Prior Session was Cycle Day 3: Markets are entering a full two-weeks of broad consolidation between 19840 – 20360. Breakout attempts have been mired with unsustainable bids as longs continue to lose any upside traction, which has resulted in a more broadening consolidation covering the past two-weeks. Though near all-time highs, bulls need multiple follow-through sessions to reach “escape velocity.” Prior range was 322 handles on 551k contracts exchanged.
…Transition from Cycle Day 3 to Cycle Day 1
Transition into Cycle Day 1: The bullish momentum may drive prices higher before the typical Cycle Day 1 decline begins. With the average decline measuring 20141.75, the key focus for the bulls this week will be sustaining a bid above the critical 20185-20195 zone. This multi-day composite value area high serves as a pivotal marker for continued upward movement.
If prices hold above that zone, the bullish structure is likely to maintain its edge, possibly pushing toward all-time highs. However, a break below 20170 would potentially trigger downside momentum, targeting the 20100-20080 prior mid-day lows. A further drop below 20080 would signal a possible deeper bearish move toward 20040-20020.
Our discipline of maintaining positioning that is aligned with market forces continues to serve us well, so stay the course.
As such, scenarios to consider for today’s trading.
Bull Scenario: Price sustains a bid above 20185, initially targets 20250– 20300 zone.
Bear Scenario: Price sustains an offer below 20185, initially targets 20100 – 20080 zone.
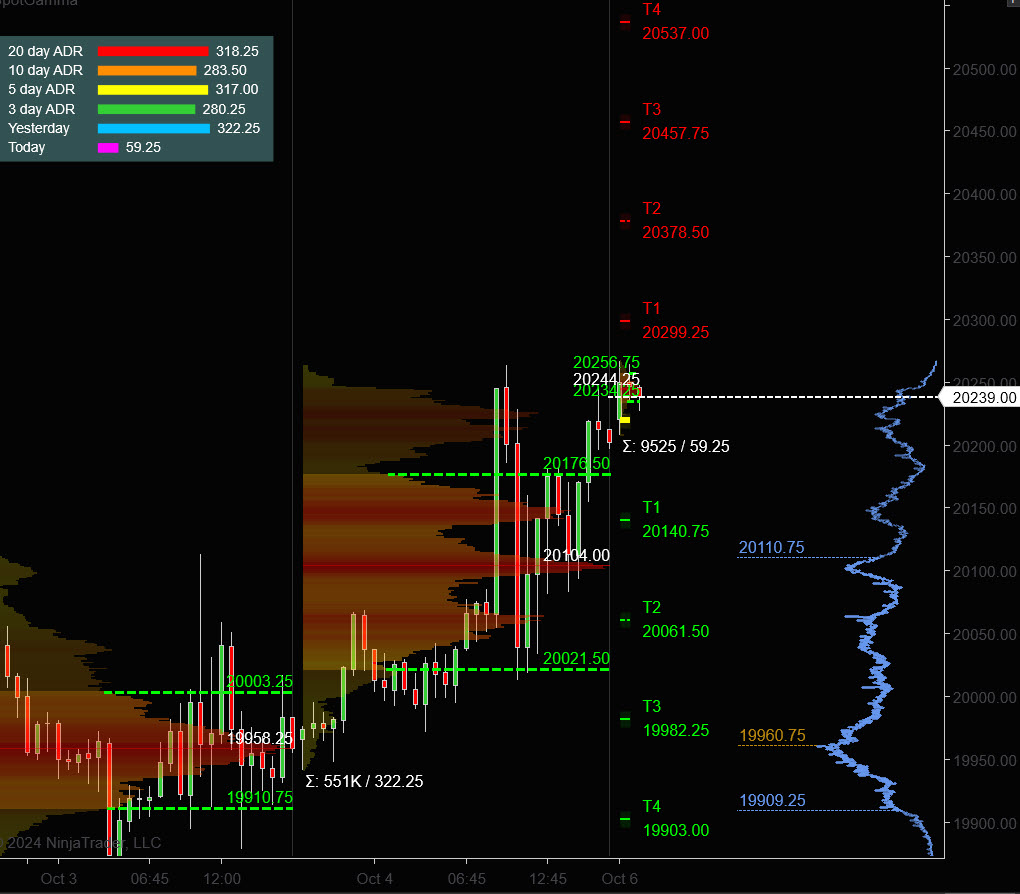
PVA High Edge = 20176 PVA Low Edge = 20021 Prior POC = 20104
NQ Chart (Profile)
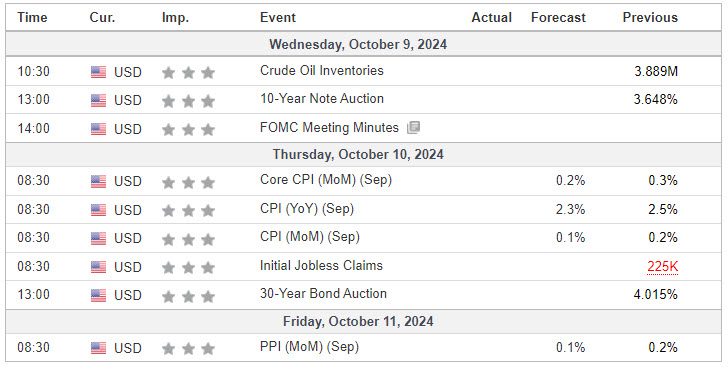
Economic Calendar
Trade Strategy: Our tactical trade strategy will simply remain unaltered…We’ll be flexible to trade both long and short side from Decision Pivot Levels. Continue to focus on Bull/Bear Stackers and Premium/Discounts. As always, remaining in alignment with dominant intra-day force increases probabilities of producing winning trades.
Stay Focused…Non-Biased…Disciplined ALWAYS USE STOPS!
Good Trading…David
“Knowing is not enough, We must APPLY. Willing is not enough, We must DO.” –BR
*****This trade strategy report is disseminated for “education only” and should not be viewed in any way as a recommendation to buy or sell futures products.”
PAST PERFORMANCE IS NOT NECESSARILY INDICATIVE OF FUTURE RESULTS
IMPORTANT NOTICE! No representation is being made that the use of this strategy or any system or trading methodology will generate profits. Past performance is not necessarily indicative of future results. There is substantial risk of loss associated with trading securities and options on equities. Only risk capital should be used to trade. Trading securities is not suitable for everyone.
Disclaimer: Futures, Options, and Currency trading all have large potential rewards, but they also have large potential risk. You must be aware of the risks and be willing to accept them in order to invest in these markets. Don’t trade with money you can’t afford to lose.
This website is neither a solicitation nor an offer to Buy/Sell futures, options, or currencies. No representation is being made that any account will or is likely to achieve profits or losses similar to those discussed on this web site. The past performance of any trading system or methodology is not necessarily indicative of future results.
CFTC RULE 4.41 –HYPOTHETICAL OR SIMULATED PERFORMANCE RESULTS HAVE CERTAIN LIMITATIONS. UNLIKE AN ACTUAL PERFORMANCE RECORD, SIMULATED RESULTS DO NOT REPRESENT ACTUAL TRADING. ALSO, SINCE THE TRADES HAVE NOT BEEN EXECUTED, THE RESULTS MAY HAVE UNDER-OR-OVER COMPENSATED FOR THE IMPACT, IF ANY, OF CERTAIN MARKET FACTORS, SUCH AS LACK OF LIQUIDITY. SIMULATED TRADING PROGRAMS IN GENERAL ARE ALSO SUBJECT TO THE FACT THAT THEY ARE DESIGNED WITH THE BENEFIT OF HINDSIGHT. NO REPRESENTATION IS BEING MADE THAT ANY ACCOUNT WILL OR IS LIKELY TO ACHIEVE PROFIT OR LOSSES SIMILAR TO THOSE SHOWN