
S&P 500 (ES)

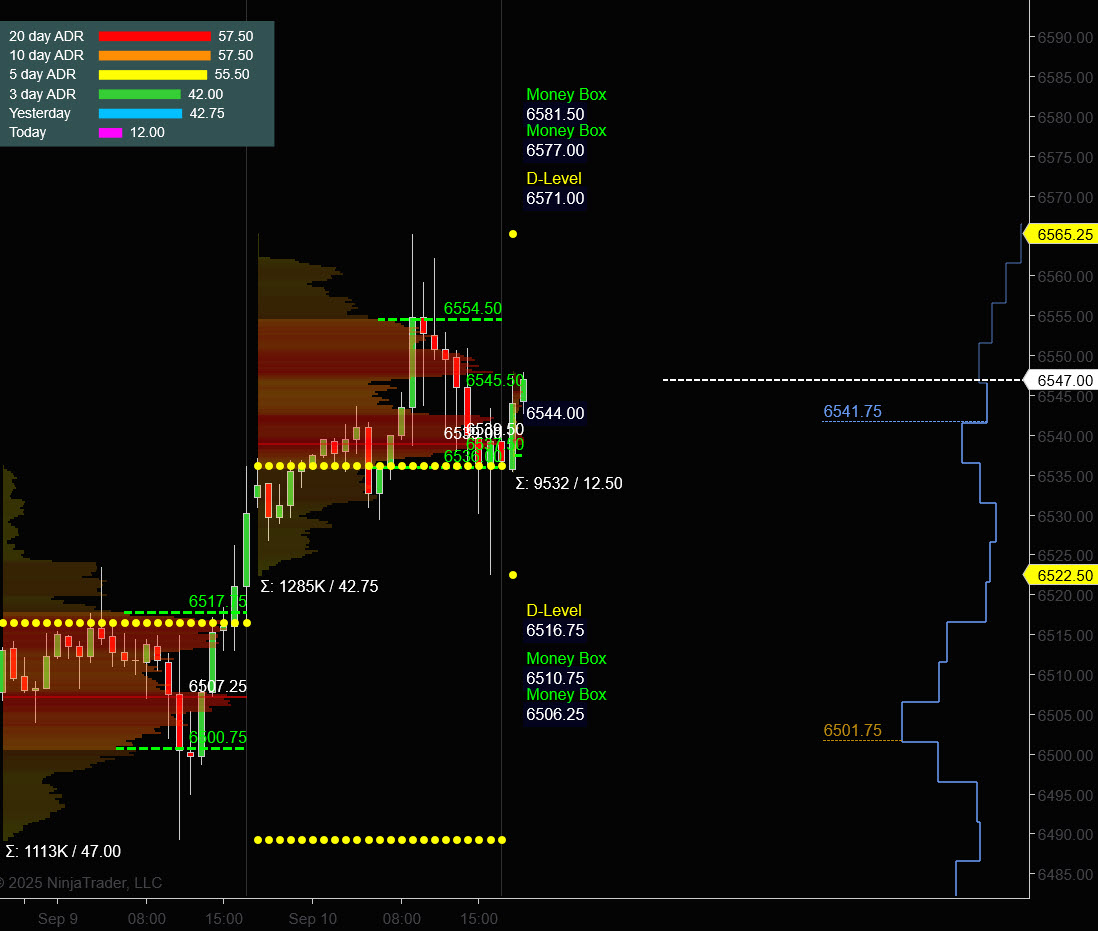
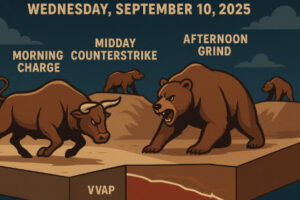 Prior Session was Cycle Day 3: Price continued this cycle’s rally fulfilling the 3 Day Cycle Target (6555) as well as the Penetration Level (6563), before reversing direction lower testing the 6520 Line in the Sand (LIS).
The targets reached 85 pts (113.57%) of the normal 74.84 pts. Not quite a super cycle, but certainly strong.
Range for this session was 42 handles on 1.285M contracts exchanged.
For a more detailed recap of the trading session, click on this link: Trading Room RECAP 9.10.25
FREE TRIAL link to PTG/Taylor Three Day Cycle
 …Transition from Cycle Day 3 to Cycle Day 1
Transition into Cycle Day 1: Today begins a new cycle with the average decline projection zone between (6427.25) and (6519.00) which have already been fulfilled.
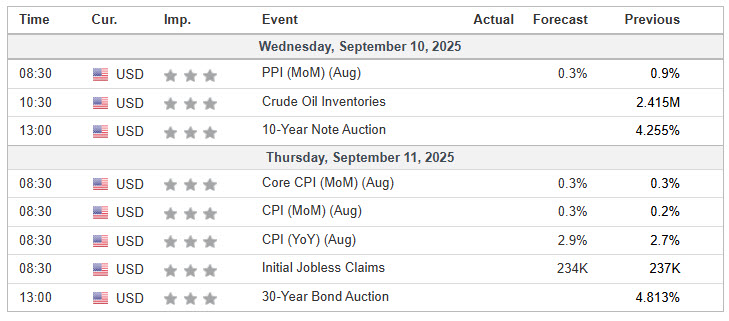
The U.S. Consumer Price Index (CPI) report for August 2025, scheduled for release on Thursday, September 11, 2025, at 8:30 a.m. Eastern Time.
Below we preview the report:
What to Expect in the Report
Release Schedule
-
The CPI for August 2025 will be published precisely at 8:30 a.m. ET on Thursday, September 11, 2025 Bureau of Labor Statistics+1.
-
It will include both the headline CPI, reflecting overall inflation, and the core CPI, which excludes volatile food and energy sectors Kiplinger+1.
Forecasts & Market Expectations
Economic forecasts indicate:
-
Headline CPI is expected to rise 2.9% year-over-year, up from 2.7% in July—marking the highest reading since January Investopedia+1.
-
Core CPI is anticipated to hold steady around 3.1%, a multi-month high fueled largely by rising core goods prices—potentially tied to tariff pressures Investopedia+1.
Why This Report Matters
-
Markets and policymakers are closely watching the CPI data for signs of persistent inflation, which will heavily influence Federal Reserve decisions on interest rates.
-
Despite growing calls for rate cuts in September, especially amid signs of labor market softness, elevated inflation readings—particularly in core categories—could complicate or delay any policy easing Kiplinger+3Investopedia+3Kiplinger+3.
Of course, nothing changes for PTG…Simply follow your plan. Take only Triple A setups and manage the $risk. ALWAYS HAVE HARD STOP-LOSSES in-place on the exchange.
PTG’s Primary Directive (PD) is to ALWAYS STAY IN ALIGNMENT with the DOMINANT FORCE.
As such, scenarios to consider for today’s trading.
Bull Scenario: Price sustains a bid above 6540+-, initially targets 6555 – 6560 zone.
Bear Scenario: Price sustains an offer below 6540+-, initially targets 6525– 6520 zone.
PVA High Edge = 6555 PVA Low Edge = 6535 Prior POC = 6540
ESU
Nasdaq (NQ)

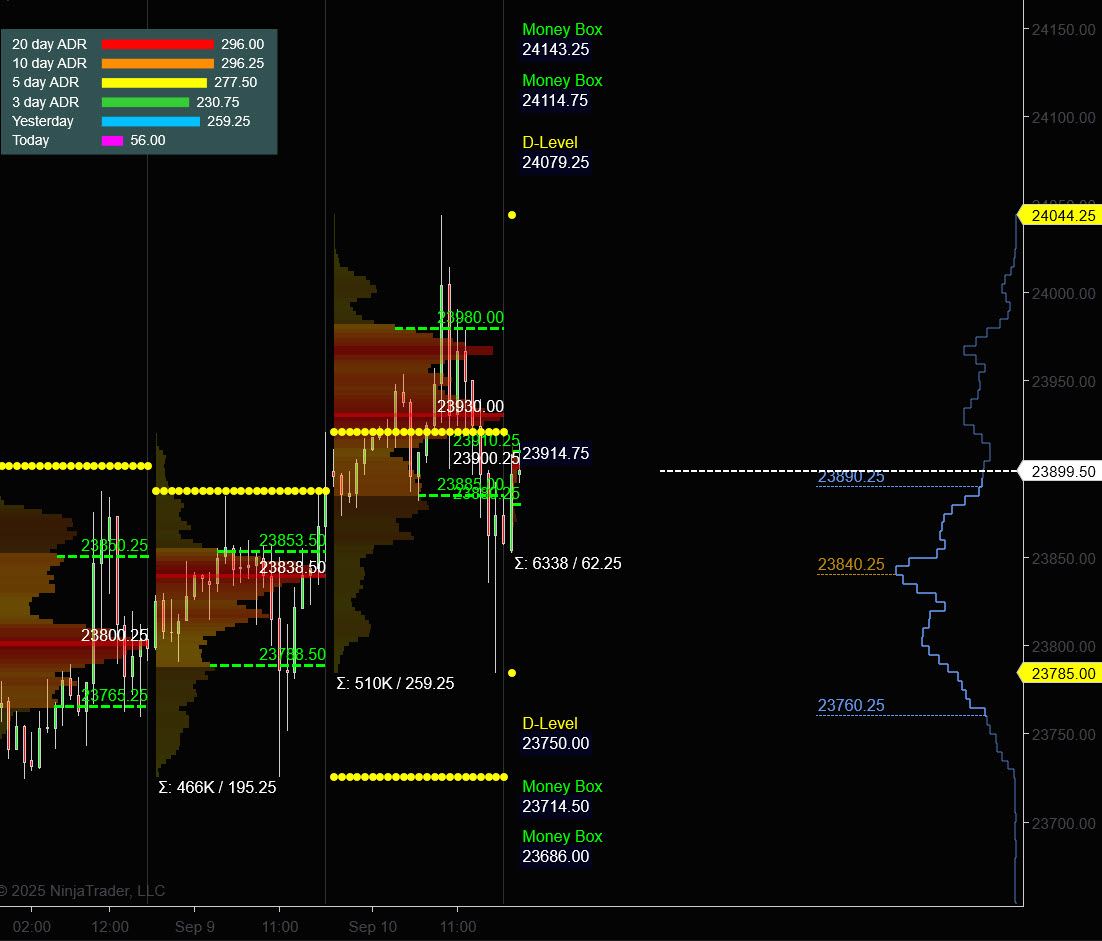
Prior Session was Cycle Day 3: Price continued this cycle’s rally fulfilling the 3 Day Cycle Target Zone (23998.50 – 24066.75) with ultra laser precision. Range for this session was 259 handles on 510k contracts exchanged.
…Transition from Cycle Day 3 to Cycle Day 1
Transition into Cycle Day 1: Today begins a new cycle with the average decline projection zone between (23908) and (23821) which have already been fulfilled.
Of course, nothing changes for PTG…Simply follow your plan. Take only Triple A setups and manage the $risk. ALWAYS HAVE HARD STOP-LOSSES in-place on the exchange.
PTG’s Primary Directive (PD) is to ALWAYS STAY IN ALIGNMENT with the DOMINANT FORCE.
As such, scenarios to consider for today’s trading.
Bull Scenario: Price sustains a bid above 23930+-, initially targets 23980– 24045 zone.
Bear Scenario: Price sustains an offer below 23930+-, initially targets 23885 – 23840 zone.
PVA High Edge = 23980 PVA Low Edge = 23885 Prior POC = 23930
NQU
Economic Calendar
Trade Strategy: Our tactical trade strategy will simply remain unaltered…We’ll be flexible to trade both long and short side from Decision Pivot Levels. Continue to focus on Bull/Bear Stackers and Premium/Discounts. As always, remaining in alignment with dominant intra-day force increases probabilities of producing winning trades.
Stay Focused…Non-Biased…Disciplined ALWAYS USE STOPS!
Good Trading…David
“Knowing is not enough, We must APPLY. Willing is not enough, We must DO.” –BR
*****This trade strategy report is disseminated for “education only” and should not be viewed in any way as a recommendation to buy or sell futures products.”
PAST PERFORMANCE IS NOT NECESSARILY INDICATIVE OF FUTURE RESULTS
IMPORTANT NOTICE! No representation is being made that the use of this strategy or any system or trading methodology will generate profits. Past performance is not necessarily indicative of future results. There is substantial risk of loss associated with trading securities and options on equities. Only risk capital should be used to trade. Trading securities is not suitable for everyone.
Disclaimer: Futures, Options, and Currency trading all have large potential rewards, but they also have large potential risk. You must be aware of the risks and be willing to accept them in order to invest in these markets. Don’t trade with money you can’t afford to lose.
This website is neither a solicitation nor an offer to Buy/Sell futures, options, or currencies. No representation is being made that any account will or is likely to achieve profits or losses similar to those discussed on this web site. The past performance of any trading system or methodology is not necessarily indicative of future results.
CFTC RULE 4.41 –HYPOTHETICAL OR SIMULATED PERFORMANCE RESULTS HAVE CERTAIN LIMITATIONS. UNLIKE AN ACTUAL PERFORMANCE RECORD, SIMULATED RESULTS DO NOT REPRESENT ACTUAL TRADING. ALSO, SINCE THE TRADES HAVE NOT BEEN EXECUTED, THE RESULTS MAY HAVE UNDER-OR-OVER COMPENSATED FOR THE IMPACT, IF ANY, OF CERTAIN MARKET FACTORS, SUCH AS LACK OF LIQUIDITY. SIMULATED TRADING PROGRAMS IN GENERAL ARE ALSO SUBJECT TO THE FACT THAT THEY ARE DESIGNED WITH THE BENEFIT OF HINDSIGHT. NO REPRESENTATION IS BEING MADE THAT ANY ACCOUNT WILL OR IS LIKELY TO ACHIEVE PROFIT OR LOSSES SIMILAR TO THOSE SHOWN