
S&P 500 (ES)

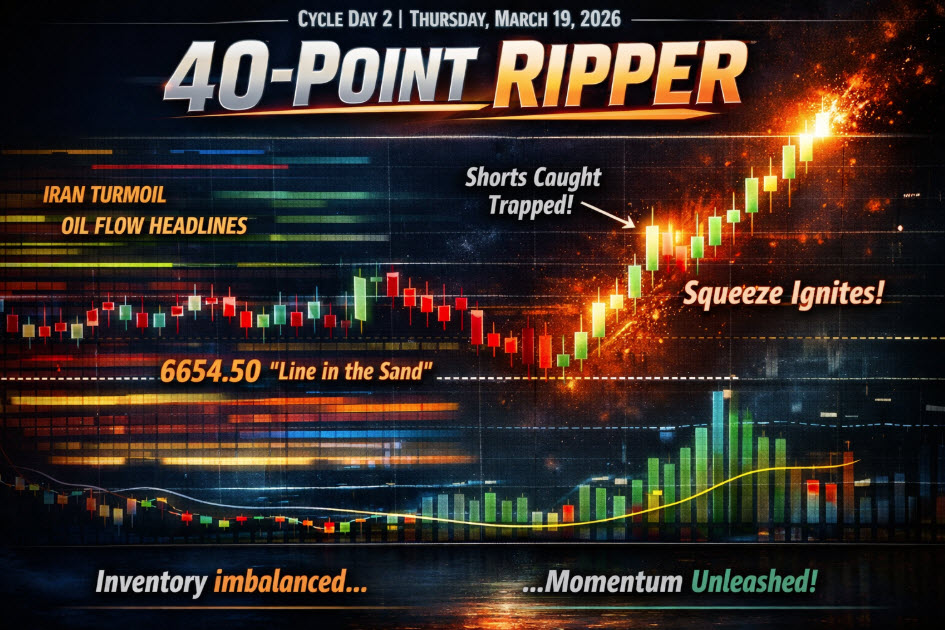
Cycle Day 2 — The Pressure Test Holds… Then Snaps
Thursday, March 19, 2026
Cycle Day 2 delivered exactly what it often does best—frustration, compression, and a test of conviction… before finally revealing its hand late in the session.
 🎯 Opening Theme: Two-Way Chop & Early Failure
The session began with high volatility and lack of directional commitment:
-
@CL and @NQ Open Range plays both stopped out
-
@ES Open Range Long triggered, but lacked immediate continuation
-
Price initially balanced around D-Level (6633)
This set the tone early:
Not a trend day… a decision day
For greater detail of how this day unfolded, click on the Trading Room RECAP 3.19.26 link.
🔄 Cycle Day 2 ➜ Cycle Day 3 Transition
 “The Positioning Release”

Cycle Day 2 built the pressure.
Cycle Day 3 decides where that pressure resolves—and this time, it’s happening inside the gravitational pull of a record-breaking Triple Witching event.
⚙️ The Real Driver: Dealer Positioning + Expiration Gravity
This isn’t just about contracts expiring.
It’s about what dealers must do into expiration:
-
Unwind hedges
-
Roll exposure
-
Neutralize gamma
-
Flatten risk into the close
With ~$5.7 TRILLION in play, flows matter more than opinions.
🧲 Max Pain = The Battlefield
These levels are not predictions.
They are magnets and friction zones:
-
$SPX → 6750
-
$SPY → 680
-
$NDX → 25,000
-
$QQQ → 440
-
$TQQQ → 47.50
What this means tactically:
👉 Below Max Pain
-
Dealers often long gamma
-
They buy dips / sell rips
-
Market = mean-reverting, sticky
👉 As Price Moves Toward Max Pain
-
Hedging flows can accelerate price upward
-
Feels like a “pull” into the level
👉 At / Near Max Pain
-
Expect pinning behavior
-
Heavy two-sided trade
-
False breakouts likely
👉 Above Max Pain
-
Resistance increases
-
Moves can stall or sharply reject
🔥 Cycle Day 3 Overlay: What Actually Matters
Cycle Day 3 is NOT about chasing.
It’s about acceptance vs rejection under extreme liquidity conditions.
Three Scenarios:
🟢 Scenario 1: Grind Toward Max Pain
-
Slow bid, controlled structure
-
Pullbacks get bought
-
Dealers assisting via hedging flows
Trade Lens:
➡️ Stay with trend
➡️ Don’t overtrade noise
➡️ Expect late-day pinning
🔴 Scenario 2: Rejection Before Max Pain
-
Market fails to reach magnet
-
Supply overwhelms hedging flows
Trade Lens:
➡️ Failed auction = directional opportunity
➡️ Look for expansion AWAY from max pain
➡️ Momentum > mean reversion
⚡ Scenario 3: Witching Hour Chaos (3–4 PM ET)
-
Volume spike
-
Violent rotations
-
Programs + institutional rolls dominate
Trade Lens:
➡️ This is NOT clean price action
➡️ Either:
-
Be flat
-
Or trade VERY small and reactive
🧠 Key Insight Most Traders Miss
Max pain doesn’t “pull” price by magic.
👉 It works because of hedging mechanics + positioning imbalances
And on Triple Witching, those flows are:
-
Compressed in time
-
Massive in size
-
Non-linear in impact
🎯 Cycle Day 3 Mindset
This is not a day to predict.
This is a day to observe who is in control:
-
Is price being accepted higher?
-
Or is it rejecting into liquidity?
-
Are moves clean… or forced?
⚔️ The Bottom Line
Cycle Day 2 created imbalance.
Cycle Day 3—on the largest March expiration ever—decides:
Does the market resolve higher into dealer support…
or break away as positioning unwinds?
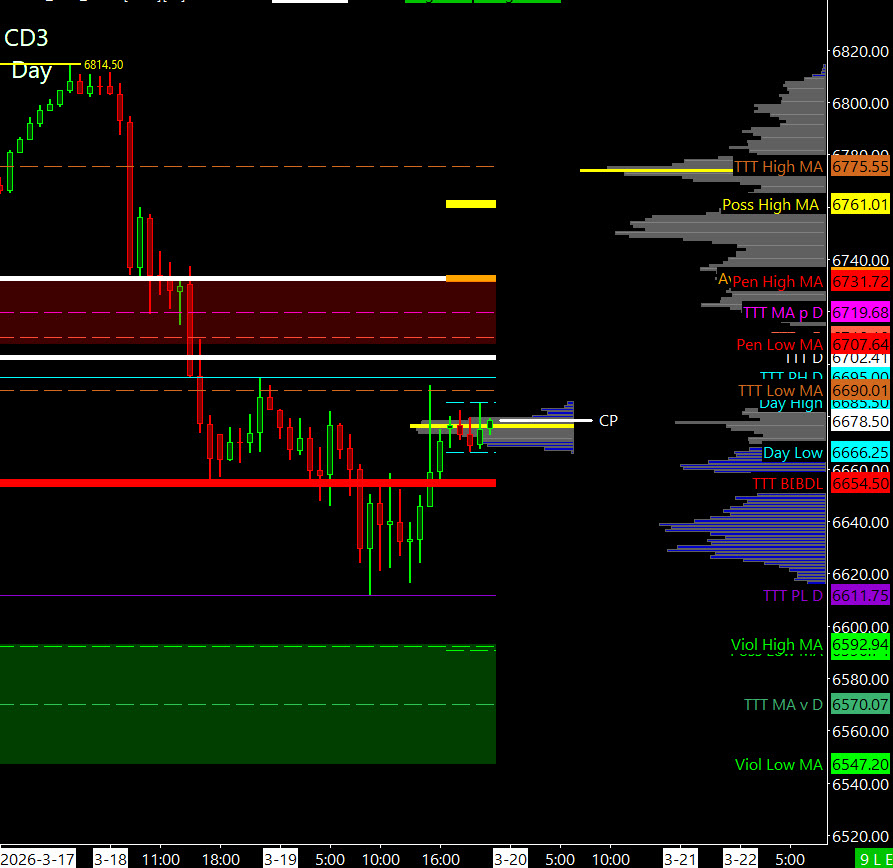
🟢 Bull Case — Buyers Stay in Control
Acceptance north of 6675 ±5
If buyers defend value and maintain acceptance above this pivot zone, upside continuation remains viable.
Initial Upside Objectives:
-
6725
-
6705
-
6690
Orderly trade. Controlled tempo. Inventory stays clean.
🔴 Bear Case — Rotation / Reset
Acceptance south of 6675 ±5
Failure to hold the pivot opens the door to rotation and balance repair.
Initial Downside Objectives:
-
6660
-
6650
-
6635
📊 Key Reference Levels
-
PVA High Edge: 6655
-
PVA Low Edge: 6717
-
Prior POC: 6639
These are your magnets.
These are your battlegrounds.
These are the levels where professionals manage risk — not chase emotion.
⚠️ Tactical Takeaway
Of course, nothing changes for PTG…Simply follow your plan. Take only Triple A setups and manage the $risk. ALWAYS HAVE HARD STOP-LOSSES in-place on the exchange.
PTG’s Primary Directive (PD) is to ALWAYS STAY IN ALIGNMENT with the DOMINANT FORCE.
ESH
Nasdaq (NQ)

…Transition from Cycle Day 2 → Cycle Day 3
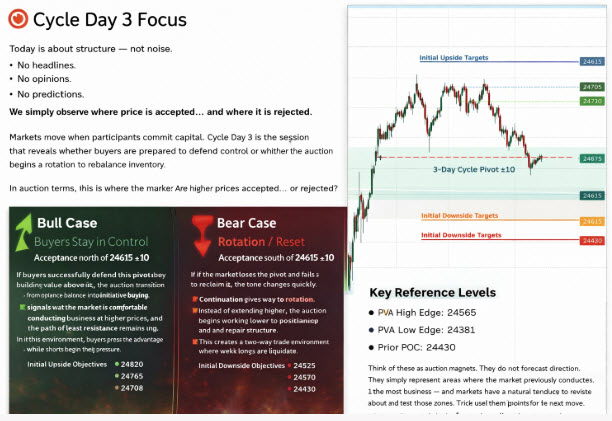
🎯 Cycle Day 3 Focus
Today is about structure — not noise.
No headlines.
No opinions.
No predictions.
We simply observe where price is accepted… and where it is rejected.
Markets move when participants commit capital.
Cycle Day 3 is the session that reveals whether buyers are prepared to defend control or whether the auction begins a rotation to rebalance inventory.
In auction terms, this is where the market answers the only question that matters:
Are higher prices accepted… or rejected?
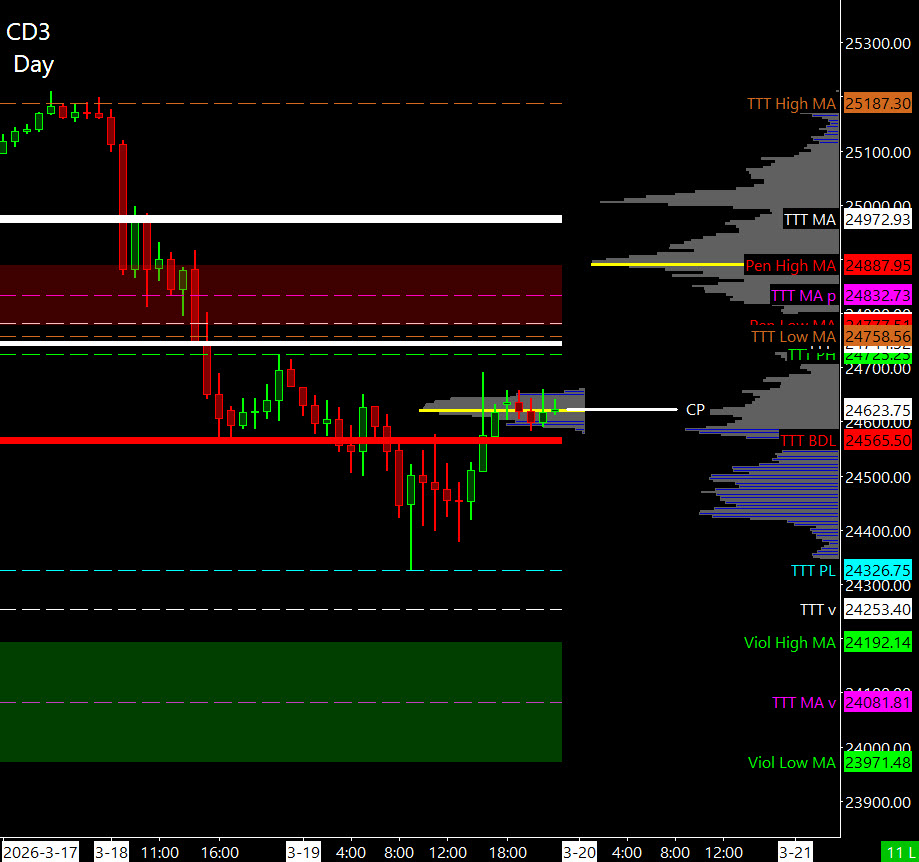
🟢 Bull Case — Buyers Stay in Control
Acceptance north of 24615 ±10
If buyers successfully defend this pivot and begin building value above it, the auction transitions from balance into initiative buying.
That signals the market is comfortable conducting business at higher prices, and the path of least resistance remains upward.
In this environment, buyers press the advantage while shorts begin to feel pressure.
Initial Upside Objectives
• 24820
• 24765
• 24708
Acceptance through these levels invites momentum participation and can trigger short covering, which fuels the next leg of the auction higher.
When that happens, the market is no longer rotating.
It is expanding the range.
🔴 Bear Case — Rotation / Reset
Acceptance south of 24615 ±10
If the market loses the pivot and fails to reclaim it, the tone changes quickly.
Continuation gives way to rotation.
Instead of extending higher, the auction begins working lower to rebalance positioning and repair structure.
This creates a two-way trade environment where weak longs are forced to liquidate.
Initial Downside Objectives
• 24525
• 24470
• 24430
Acceptance below these levels opens the door for tests of deeper structural support, and late longs may begin re-evaluating their career choices.
📊 Key Reference Levels
PVA High Edge: 24565
PVA Low Edge: 24381
Prior POC: 24430
Think of these as auction magnets.
They do not forecast direction.
They simply represent areas where the market previously conducted the most business — and markets have a natural tendency to revisit and test those zones.
Price will often gravitate toward them, rotate around them, or use them as launch points for the next move.
⚔️ Bottom Line
Cycle Day 3 is not about prediction.
It is about observation and alignment.
We watch where the market accepts value.
Then we trade with the side willing to defend it.
🧠 Professional Mindset
Professional traders do not predict.
They observe:
• Acceptance vs Rejection
• Initiative vs Response
• Who is in control of the auction
Then they align with the side showing commitment and control.
⚔️ Stay disciplined.
📊 Stay structured.
🎯 Stay aligned with the auction.
⚠️ Tactical Takeaway
Of course, nothing changes for PTG…Simply follow your plan. Take only Triple A setups and manage the $risk. ALWAYS HAVE HARD STOP-LOSSES in-place on the exchange.
PTG’s Primary Directive (PD) is to ALWAYS STAY IN ALIGNMENT with the DOMINANT FORCE.
NQH
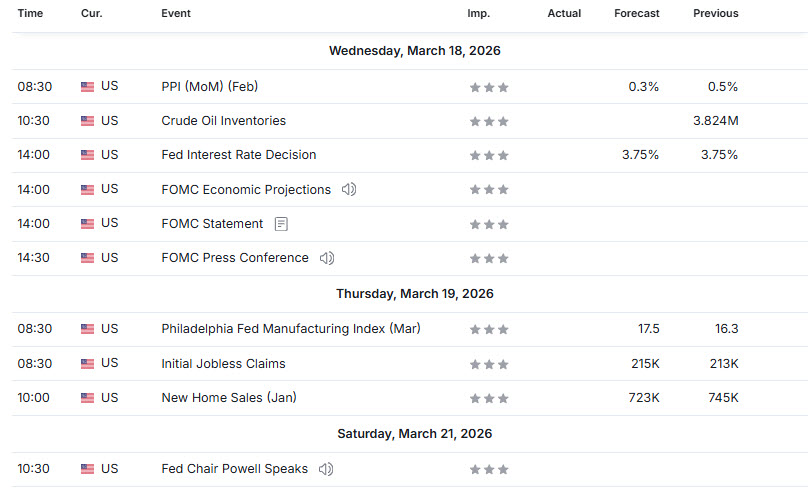
Economic Calendar
Trade Strategy: Our tactical trade strategy will simply remain unaltered…We’ll be flexible to trade both long and short side from Decision Pivot Levels. Continue to focus on Bull/Bear Stackers and Premium/Discounts. As always, remaining in alignment with dominant intra-day force increases probabilities of producing winning trades.
Stay Focused…Non-Biased…Disciplined ALWAYS USE STOPS!
Good Trading…David
“Knowing is not enough, We must APPLY. Willing is not enough, We must DO.” –BR
*****This trade strategy report is disseminated for “education only” and should not be viewed in any way as a recommendation to buy or sell futures products.”
PAST PERFORMANCE IS NOT NECESSARILY INDICATIVE OF FUTURE RESULTS
IMPORTANT NOTICE! No representation is being made that the use of this strategy or any system or trading methodology will generate profits. Past performance is not necessarily indicative of future results. There is substantial risk of loss associated with trading securities and options on equities. Only risk capital should be used to trade. Trading securities is not suitable for everyone.
Disclaimer: Futures, Options, and Currency trading all have large potential rewards, but they also have large potential risk. You must be aware of the risks and be willing to accept them in order to invest in these markets. Don’t trade with money you can’t afford to lose.
This website is neither a solicitation nor an offer to Buy/Sell futures, options, or currencies. No representation is being made that any account will or is likely to achieve profits or losses similar to those discussed on this web site. The past performance of any trading system or methodology is not necessarily indicative of future results.
CFTC RULE 4.41 –HYPOTHETICAL OR SIMULATED PERFORMANCE RESULTS HAVE CERTAIN LIMITATIONS. UNLIKE AN ACTUAL PERFORMANCE RECORD, SIMULATED RESULTS DO NOT REPRESENT ACTUAL TRADING. ALSO, SINCE THE TRADES HAVE NOT BEEN EXECUTED, THE RESULTS MAY HAVE UNDER-OR-OVER COMPENSATED FOR THE IMPACT, IF ANY, OF CERTAIN MARKET FACTORS, SUCH AS LACK OF LIQUIDITY. SIMULATED TRADING PROGRAMS IN GENERAL ARE ALSO SUBJECT TO THE FACT THAT THEY ARE DESIGNED WITH THE BENEFIT OF HINDSIGHT. NO REPRESENTATION IS BEING MADE THAT ANY ACCOUNT WILL OR IS LIKELY TO ACHIEVE PROFIT OR LOSSES SIMILAR TO THOSE SHOWN