
🚀 SUPER-CYCLE UNLEASHED — 290 HANDLES OF PURE BULLISH INSANITY!
The Bulls Brought the Bazookas…The Bears Brought a Butter Knife!
Well, well, well…
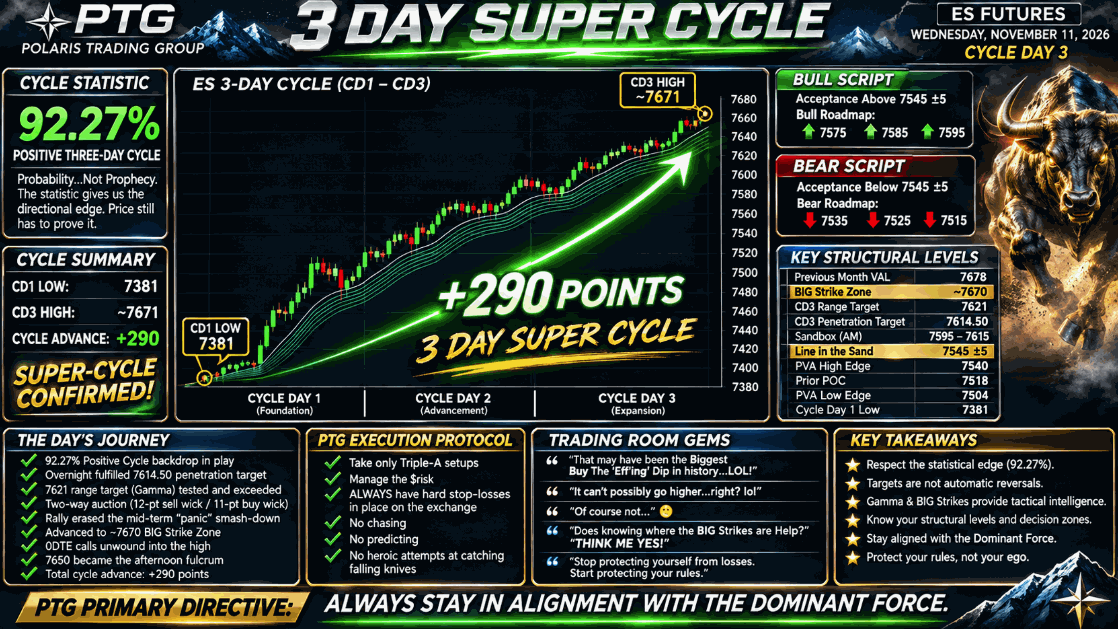
What began as a statistically favorable Cycle Day 3 transformed into an outright BULL STAMPEDE, with the ES traversing an extraordinary 290 POINTS from the Cycle Day 1 Low.
Not your typical garden-variety Three-Day Cycle.
Not even close.
Ladies and gentlemen, we officially entered SUPER-CYCLE TERRITORY!
And apparently, somebody forgot to tell the Bulls that markets are occasionally supposed to go DOWN.
The Bears?
Last seen consulting their therapists, reviewing their margin statements, and questioning their career choices. 😎
🎯 The Morning Mission — Respect the Odds
We entered today’s session armed with a 92.27% Positive Three-Day Cycle statistic.
Notice we said probability.
Not prophecy.
The statistic provides the historical directional backdrop. Price still has to prove it.
Our original battle plan established the 7545 ±5 Line in the Sand, with clearly defined objectives:
| Bull Roadmap | Bear Roadmap |
|---|---|
| 7575 | 7535 |
| 7585 | 7525 |
| 7595 | 7515 |
But the overnight Bulls weren’t interested in waiting for the opening bell.
By 8:54 AM, price had already fulfilled the 7614.50 Cycle Day 3 Penetration Target, leaving the 7621 Range Target as the next objective.
And 7621 carried additional significance.
It aligned with an important Gamma Level.
A potential resistance zone? Absolutely.
An automatic short signal?
ABSOLUTELY NOT!
As we frequently remind the room, price levels are areas for decisions, not invitations to abandon your trading plan.
🏎️ The SUPER-CYCLE — From 235 to 290 Points!
CYCLE DAY 1 LOW
7381
CYCLE ADVANCE
+290
POSITIVE CYCLE STAT
92.27%
By 8:56 AM, the cycle had already traveled 235 points.
SUPER-CYCLE STATUS CONFIRMED.
But apparently, the Bulls considered 235 points merely a warm-up exercise.
The opening auction delivered some entertaining two-way volatility, including the 12-point selling wick and 11-point buying wick identified by Bruce F on the five-minute chart.
Our initial intraday sandbox was established between 7595–7615.
Price explored, rotated, and tested the auction.
Then the buyers returned.
By 1:23 PM, the rally had essentially erased the recent midterm panic-driven smash-down.
As noted in the room:
“That may have been the Biggest Buy The ‘Eff’ing’ Dip in history…LOL!”
The Bears had their bearish narratives.
The Bulls had their BUY ORDERS.
And the market made it abundantly clear which side possessed the dominant force.
By 1:59 PM, the cycle had traversed approximately 290 POINTS.
Now THAT is a SUPER-CYCLE!
⚔️ The BIG Strike Zone — Where Gamma Meets Reality
As the afternoon progressed, attention shifted toward the 7670 BIG STRIKE ZONE.
This was no random number pulled from the financial fortune-cookie jar.
Major options strikes and associated positioning can influence market behavior, particularly during sessions dominated by short-dated options activity.
At 1:57 PM, we identified another significant structural reference:
7678 — Previous Month Value Area Low.
Meanwhile, the market continued its one-time-framing higher.
But around 2:05 PM, the 7670 area appeared to produce a temporary top.
Shortly afterward, we observed what appeared to be the unwinding of 0DTE call positions.
Remember yesterday’s observation that buyers had doubled their 7500 call line?
Options positioning matters.
Not because Gamma Levels predict the future, but because they help identify areas where significant hedging flows and market reactions may occur.
At 2:09 PM, we posed a simple question:
“Does knowing where the BIG Strikes are Help?”
Our answer?
THINK ME YES! 🎯
By 2:48 PM, 7650 emerged as the afternoon fulcrum, providing another tactical reference as the market worked through its late-session auction.
The lesson?
Knowing where the battlefield is located provides a distinct advantage over wandering around with a blindfold and a market order.
🧠 Trading Psychology — The Market Doesn’t Care What You Think
Bruce F provided the perfect commentary at 1:46 PM:
“It can’t possibly go higher…right? lol”
Our response?
“Of course not…” 😶
And therein lies one of the greatest psychological traps in trading.
Markets can remain overbought far longer than traders can remain solvent attempting to pick tops.
Extended does not automatically mean SHORT.
Oversold does not automatically mean BUY.
And a trader’s personal opinion?
Well, the CME doesn’t accept opinions as margin collateral.
The Dominant Force determines the directional advantage.
Our job is not to argue with it.
Our job is to ALIGN with it.
📊 Structural Intelligence — The Levels That Mattered
| Reference | Price | Tactical significance |
|---|---|---|
| Previous Month VAL | 7678 | Higher structural reference |
| BIG Strike Zone | ~7670 | Potential resistance / reversal |
| Afternoon Fulcrum | 7650 | Late-session decision area |
| CD3 Range Target | 7621 | Target / Gamma confluence |
| CD3 Penetration Target | 7614.50 | Fulfilled overnight |
| Morning Sandbox | 7595–7615 | Early-session auction |
| Original LIS | 7545 ±5 | Initial directional pivot |
| PVA High Edge | 7540 | Prior value boundary |
| Prior POC | 7518 | Prior accepted value |
| PVA Low Edge | 7504 | Lower value boundary |
| Cycle Day 1 Low | 7381 | Cycle structural foundation |
The critical distinction: these are reference levels, not guaranteed turning points.
The market decides whether a level becomes support, resistance, or simply another speed bump on the highway to higher prices.
🏆 Lessons From the Trading Room
Today’s session reinforced several core PTG principles.
1. Respect the Statistical Edge. The 92.27% Positive Three-Day Cycle provided the historical backdrop, but price action supplied the confirmation.
2. Never Confuse Targets With Reversals. Reaching 7621 did not automatically mean the Bulls were finished. The subsequent advance made that abundantly clear.
3. Gamma Levels Provide Tactical Intelligence. The 7670 BIG Strike Zone illustrated the value of monitoring major options positioning alongside price structure.
4. Protect Your Rules, Not Your Ego. One of today’s most important reminders:
“Stop protecting yourself from losses. Start protecting your rules.”
5. Stay Aligned With the Dominant Force. Trying to fade a runaway Super-Cycle simply because it has traveled a long distance is not a trading strategy.
It’s a potentially expensive hobby.
🎬 Final Takeaway — THE BULLS OWNED THE BATTLEFIELD!
Cycle Day 3 delivered an extraordinary expansion.
The 7614.50 Penetration Target was fulfilled.
The 7621 Range Target was overtaken.
The rally advanced toward the formidable 7670 BIG Strike Zone.
And the cycle ultimately traversed approximately 290 ES POINTS from its CD1 Low.
The Bulls were relentless.
The Bears were defensive.
And the market provided yet another reminder that statistical probabilities, structural references, and disciplined execution are far more valuable than predictions.
For everyone who spent the session insisting:
“It can’t possibly go any higher!”
The Bulls had one final response:
“HOLD MY BEER!” 🍺
PTG PRIMARY DIRECTIVE: ALWAYS STAY IN ALIGNMENT WITH THE DOMINANT FORCE.
Take only Triple-A setups — Alignment, Assignment, Attack.
Manage the $risk.
ALWAYS maintain hard stop-loss orders on the exchange.
No chasing. No predicting. No heroic attempts at catching falling knives.
Trade the Plan. Respect the Levels. Protect the Capital.
— PTGDavid | Polaris Trading Group
🔗 PTG OFFICIAL LINKS & TRADING ROOM CHARTS
Official PTG Resources
Original Trading Room Charts — November 11, 2026
Every original chart link is preserved below, in chronological order.
9:27 AM — Opening Market Structure

9:42 AM — Bruce F: Five-Minute Buying/Selling Wicks

10:24 AM — Intraday Market Chart

1:50 PM — BIG Strike Zone

2:08 PM — 0DTE Call Unwinding / Strike Zone

Additional Trading Room Links
⚠️ CFTC RULE 4.41 — RISK DISCLOSURE
CFTC Rule 4.41 — Official PTG Disclaimer Notice

Risk Disclaimer: Trading futures involves substantial risk and is not suitable for all investors. Past performance is not necessarily indicative of future results. Hypothetical or simulated performance results have inherent limitations and do not represent actual trading.