Happy New Year and Welcome Back to the Polaris Trading Group Blog.
We have been on a six month hiatus from blog postings as we have been diligently working on our newly designed website www.polaristradinggroup.com. Please stop by and take a look around…Be sure you sign up for free two-week trial to our S&P e-mini trading room where we discuss market action and trading profitunities in real-time.
VOLATILITY IS BACK! Finally…As every day trader knows price movement is required in order to have opportunity to profit or what we call “PROFITUNITIES”.
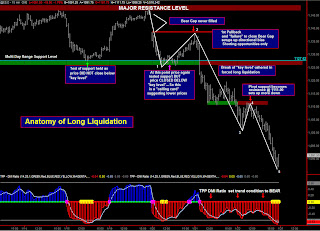
Our first post for the new year is entitled “Anatomy of Long Liquidation” and the best way to present this is through visual chart annotations shown below. To set the stage, price had been stuck in a multi-day range very near 50% retracement levels that marked the 2007 highs to the 2009 lows. The Bulls tried many times to expand above this level in order to attract “new buyers”, but there were “no takers”. So with too many “bulls” the market had become “overcrowded”…Well the seasoned trader has seen this movie several times before and frankly it’s a bad re-run and we all know the ending…It’s bad for the bulls. No different in this case this past week, as the overcrowded longs were forced into “Liquidation”.
Our movie clip starts on 1/15/10 on a test of the multi-day range support level at the 1125-1127 zone. Follow the sequence of chart annotations and see how the movie ends for the bulls…Discretion Advised…It’s Not Pretty.

