
S&P 500 (ES)

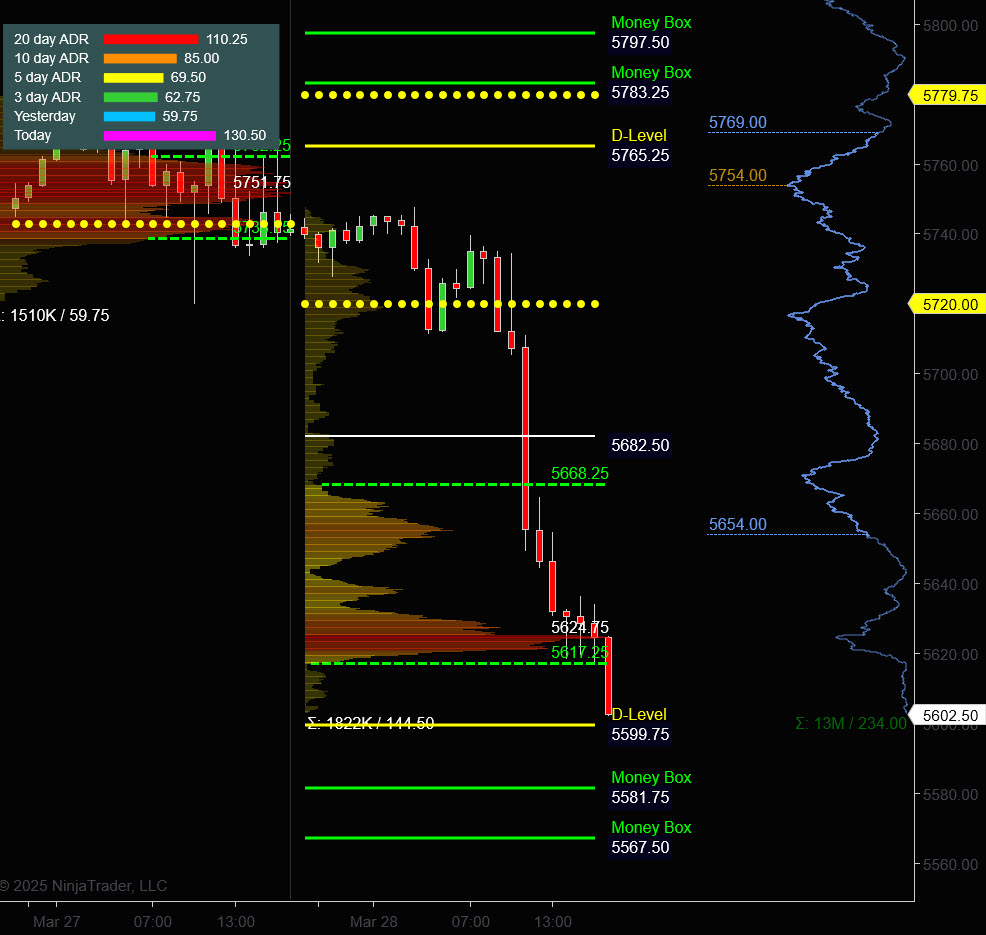
Prior Session was Cycle Day 3: Three-Day Cycle failed to produce a rally as selling sentiment was simply too strong as End of Month/Quarter and the pending April 2nd Tariff “liberation-day” were the main “risk-off” drivers. Range for this session was 144 handles on 1.822M contracts exchanged.
FREE TRIAL link to PTG/Taylor Three Day Cycle
Reframing Negative Beliefs into Empowering Ones
For a more detailed recap of the trading session, click on this link: Trading Room RECAP 3.28.25
 …Transition from Cycle Day 3 to Cycle Day 1
Transition into Cycle Day 1: Normal for CD1 is for decline with the average measuring 5654. This level was exceeded during the steep sell-off of the prior session. We’ll mark the “average extreme level” 5597 as today’s key CD1 target reference.
Being the final day of the Month/Quarter, typically there is what has come to be known as “window-dressing.” Stock market window dressing is a strategy used by fund managers and institutional investors at the end of a quarter or financial year to make their portfolios look more attractive to clients or shareholders.
***Special Section: JPMorgan Collar Trade
What is the function of the JPMorgan Quarterly Collar Trade?
The JPMorgan Quarterly Collar Trade is a structured options strategy designed to hedge a significant portion of JPMorgan’s equity exposure, typically in relation to its holdings in the JPMorgan Hedged Equity Fund or similar portfolios. The trade is implemented every quarter and follows a collar strategy, which involves:
-
Buying Put Options – Provides downside protection against a market decline.
-
Selling Call Options – Caps upside gains by obligating JPMorgan to sell the underlying asset if the price rises above a certain level.
-
Possibly Selling Additional Put Options – Helps offset the cost of buying the protective put options.
Purpose and Impact:
-
Risk Management: Helps limit downside losses while reducing the cost of the hedge by sacrificing some upside potential.
-
Portfolio Protection: Shields JPMorgan’s equity exposure from large market drawdowns.
-
Market Influence: Due to the large size of JPMorgan’s collar trade, it can impact option market flows, particularly around expiration dates, influencing volatility and hedging activity by market participants.
This trade is executed systematically on a quarterly basis, and many traders watch it closely for potential market impacts, especially in the S&P 500 options market.
****Additionally, commentary from the “Gamma Guys” (spotgamma.com)
“Monday’s Exp & the 5,565 JPM Collar put….”
“we note this move lower places the JPM 5,565 squarely in play for Monday. This matters because it sharply increases the gamma a the JPM strike, arguably making the roll more impactful on Monday. We will be operating from the assumption that dealers will be supporting the market under 5,565, with hedges designed to expire the put worthless. However, if equities open materially weaker, it could greatly increase the value of the 40k puts at the 5,565 strike, possibly invoking larger related rolling flows. So, add this element on to any last minute tariff reactions.”
Finally, MTS Trading Room posting from Danny Riley (Dboy) regarding the JPM Collar:
Dboy
Of course, nothing changes for PTG…Simply follow your plan. Take only Triple A setups and manage the $risk. ALWAYS HAVE HARD STOP-LOSSES in-place on the exchange.
PTG’s Primary Directive (PD) is to ALWAYS STAY IN ALIGNMENT with the DOMINANT FORCE.
As such, scenarios to consider for today’s trading.
Bull Scenario: Price sustains a bid above 5625+-, initially targets 5645 – 5655 zone.
Bear Scenario: Price sustains an offer below 5625+-, initially targets 5597 – 5582 zone.
PVA High Edge = 5668 PVA Low Edge = 5617 Prior POC = 5625
ESM
Nasdaq (NQ)

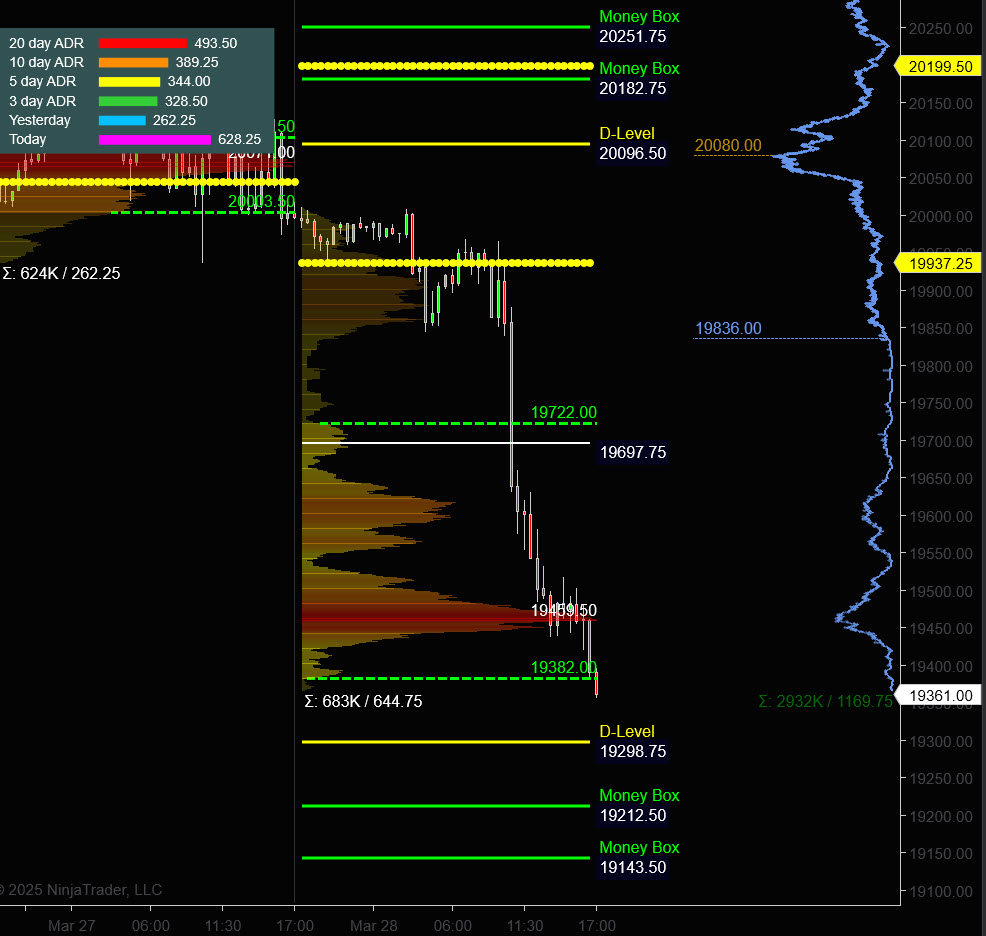
Prior Session was Cycle Day 3: NAZ failed to reclaim the prior CD1 Low (20045) creating a “failed-cycle.” This session was simply an all-out EOM/EOQ L-I-Q-U-I-D-A-T-I-O-N as panicked sellers rushed for the exits. Range for this session was 644 handles on 683k contracts exchanged.
…Transition from Cycle Day 3 to Cycle Day 1
Transition into Cycle Day 1: Normal for CD1 is for decline with the average measuring 19542. This level was exceeded during the steep sell-off of the prior session. We’ll mark the “average extreme level” 19251 as today’s key CD1 target reference.
Of course, nothing changes for PTG…Simply follow your plan. Take only Triple A setups and manage the $risk. ALWAYS HAVE HARD STOP-LOSSES in-place on the exchange.
PTG’s Primary Directive (PD) is to ALWAYS STAY IN ALIGNMENT with the DOMINANT FORCE.
As such, scenarios to consider for today’s trading.
Bull Scenario: Price sustains a bid above 19460+-, initially targets 19565 – 19630 zone.
Bear Scenario: Price sustains an offer below 19460+-, initially targets 19251 – 19200 zone.
PVA High Edge = 19722 PVA Low Edge = 19382 Prior POC = 19460
NQM
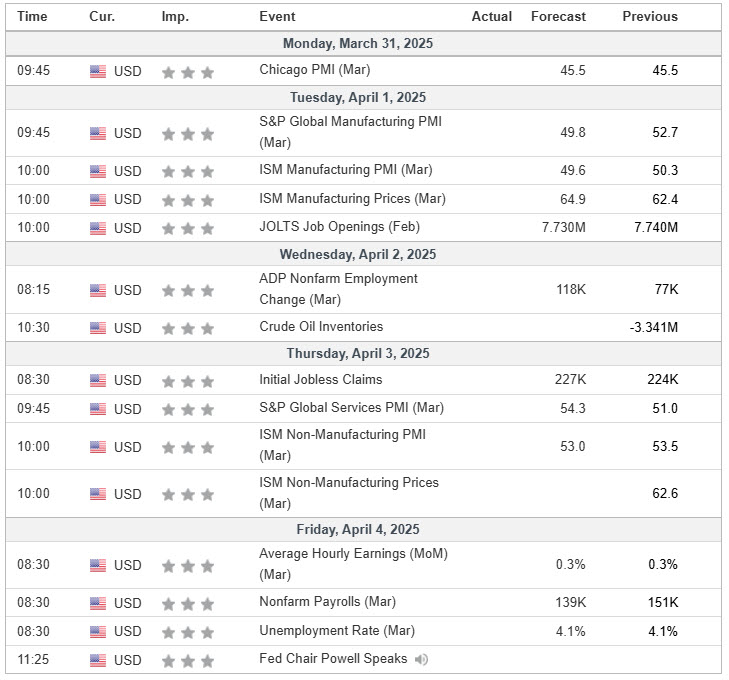
Economic Calendar
Trade Strategy: Our tactical trade strategy will simply remain unaltered…We’ll be flexible to trade both long and short side from Decision Pivot Levels. Continue to focus on Bull/Bear Stackers and Premium/Discounts. As always, remaining in alignment with dominant intra-day force increases probabilities of producing winning trades.
Stay Focused…Non-Biased…Disciplined ALWAYS USE STOPS!
Good Trading…David
“Knowing is not enough, We must APPLY. Willing is not enough, We must DO.” –BR
*****This trade strategy report is disseminated for “education only” and should not be viewed in any way as a recommendation to buy or sell futures products.”
PAST PERFORMANCE IS NOT NECESSARILY INDICATIVE OF FUTURE RESULTS
IMPORTANT NOTICE! No representation is being made that the use of this strategy or any system or trading methodology will generate profits. Past performance is not necessarily indicative of future results. There is substantial risk of loss associated with trading securities and options on equities. Only risk capital should be used to trade. Trading securities is not suitable for everyone.
Disclaimer: Futures, Options, and Currency trading all have large potential rewards, but they also have large potential risk. You must be aware of the risks and be willing to accept them in order to invest in these markets. Don’t trade with money you can’t afford to lose.
This website is neither a solicitation nor an offer to Buy/Sell futures, options, or currencies. No representation is being made that any account will or is likely to achieve profits or losses similar to those discussed on this web site. The past performance of any trading system or methodology is not necessarily indicative of future results.
CFTC RULE 4.41 –HYPOTHETICAL OR SIMULATED PERFORMANCE RESULTS HAVE CERTAIN LIMITATIONS. UNLIKE AN ACTUAL PERFORMANCE RECORD, SIMULATED RESULTS DO NOT REPRESENT ACTUAL TRADING. ALSO, SINCE THE TRADES HAVE NOT BEEN EXECUTED, THE RESULTS MAY HAVE UNDER-OR-OVER COMPENSATED FOR THE IMPACT, IF ANY, OF CERTAIN MARKET FACTORS, SUCH AS LACK OF LIQUIDITY. SIMULATED TRADING PROGRAMS IN GENERAL ARE ALSO SUBJECT TO THE FACT THAT THEY ARE DESIGNED WITH THE BENEFIT OF HINDSIGHT. NO REPRESENTATION IS BEING MADE THAT ANY ACCOUNT WILL OR IS LIKELY TO ACHIEVE PROFIT OR LOSSES SIMILAR TO THOSE SHOWN