
Markets (Top Stories)

Source: investing.com
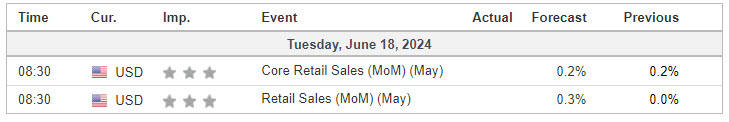
Economic Calendar
S&P 500

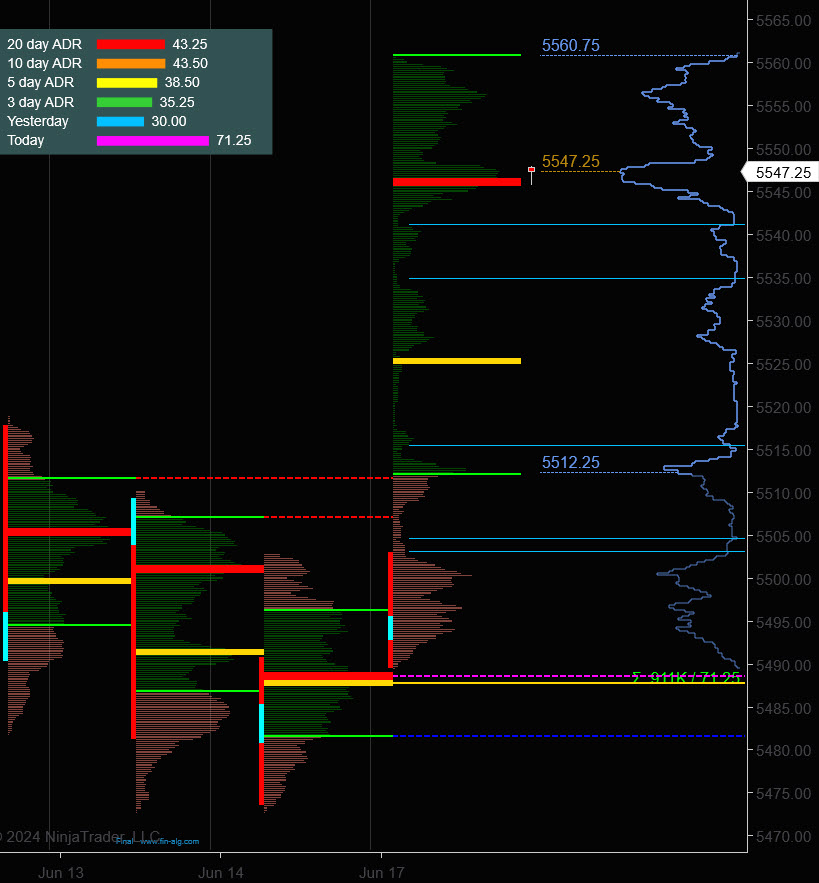
Prior Session was Cycle Day 2: Mutual Fund Monday “continuation rally” as price pushed higher more than 1.3% to another all-time high and easily eclipsing 3-Day Cycle Targets. Range was 71 handles on 1.027M contracts exchanged.
…Transition from Cycle Day 2 to Cycle Day 3
This leads us into Cycle Day 3: Cycle objectives have been exceeded during prior session, so we will mark today as a “Wild-Card.” Bulls have firm control, so it is theirs to relinquish. Price has rallied greater than 10.5% since the April low. We’ll mark 5545 as key “Line in the Sand.” Typically we’d be anticipating MATD rhythms following large range move, though final highs may not yet be in-place. As always, you know the plan…Stay aligned with dominant intra-day forces.
As such, scenarios to consider for today’s trading.
Bull Scenario: Price sustains a bid above 5545, initially targets 5560 – 5570 zone.
Bear Scenario: Price sustains an offer below 5545, initially targets 5525 – 5520 zone.
PVA High Edge = 5560 PVA Low Edge = 5504 Prior POC = 5547
PTG 3 Day Cycle
EXCLUSIVE OFFER

*****The 3 Day Cycle has a 92.11% probability of fulfilling Positive Cycle Statistics covering 12 years of recorded tracking history.
Link to: Daily Range Projections (ES) Sept (U) 2024
ES Chart
Nasdaq 100 (NQ)

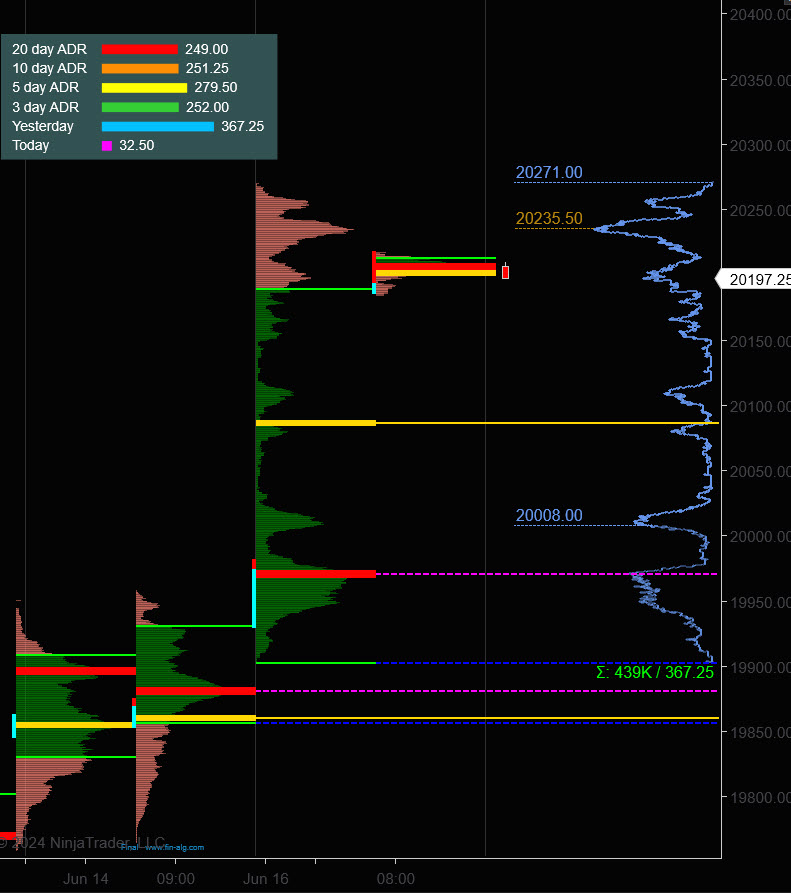
Prior Session was Cycle Day 2: Mutual Fund Monday “continuation rally” as price pushed higher more than 1.87% to another all-time high and easily eclipsing 3-Day Cycle Targets. Range was 367 handles on 504k contracts exchanged.
…Transition from Cycle Day 2 to Cycle Day 3
This leads us into Cycle Day 3: Cycle objectives have been exceeded during prior session, so we will mark today as a “Wild-Card.” Bulls have firm control, so it is theirs to relinquish. We’ll mark 20190 as key “Line in the Sand.” Typically we’d be anticipating MATD rhythms following large range move, though final highs may not yet be in-place. As always, you know the plan…Stay aligned with dominant intra-day forces.
As such, scenarios to consider for today’s trading.
.Bull Scenario: Price sustains a bid above 20190, initially targets 20270– 20320 zone.
Bear Scenario: Price sustains an offer below 20190, initially targets 20120 – 20100 zone.
PVA High Edge = 20191 PVA Low Edge = 19904 Prior POC = 19971
Link to: Daily Range Projections (NQ) Sept (U) 2024
NQ Chart
Trade Strategy: Our tactical trade strategy will simply remain unaltered…We’ll be flexible to trade both long and short side from Decision Pivot Levels. Continue to focus on Bull/Bear Stackers and Premium/Discounts. As always, remaining in alignment with dominant intra-day force increases probabilities of producing winning trades.
Stay Focused…Non-Biased…Disciplined ALWAYS USE STOPS!
Good Trading…David
“Knowing is not enough, We must APPLY. Willing is not enough, We must DO.” –BR
*****This trade strategy report is disseminated for “education only” and should not be viewed in any way as a recommendation to buy or sell futures products.”
PAST PERFORMANCE IS NOT NECESSARILY INDICATIVE OF FUTURE RESULTS
IMPORTANT NOTICE! No representation is being made that the use of this strategy or any system or trading methodology will generate profits. Past performance is not necessarily indicative of future results. There is substantial risk of loss associated with trading securities and options on equities. Only risk capital should be used to trade. Trading securities is not suitable for everyone.
Disclaimer: Futures, Options, and Currency trading all have large potential rewards, but they also have large potential risk. You must be aware of the risks and be willing to accept them in order to invest in these markets. Don’t trade with money you can’t afford to lose.
This website is neither a solicitation nor an offer to Buy/Sell futures, options, or currencies. No representation is being made that any account will or is likely to achieve profits or losses similar to those discussed on this web site. The past performance of any trading system or methodology is not necessarily indicative of future results.
CFTC RULE 4.41 –HYPOTHETICAL OR SIMULATED PERFORMANCE RESULTS HAVE CERTAIN LIMITATIONS. UNLIKE AN ACTUAL PERFORMANCE RECORD, SIMULATED RESULTS DO NOT REPRESENT ACTUAL TRADING. ALSO, SINCE THE TRADES HAVE NOT BEEN EXECUTED, THE RESULTS MAY HAVE UNDER-OR-OVER COMPENSATED FOR THE IMPACT, IF ANY, OF CERTAIN MARKET FACTORS, SUCH AS LACK OF LIQUIDITY. SIMULATED TRADING PROGRAMS IN GENERAL ARE ALSO SUBJECT TO THE FACT THAT THEY ARE DESIGNED WITH THE BENEFIT OF HINDSIGHT. NO REPRESENTATION IS BEING MADE THAT ANY ACCOUNT WILL OR IS LIKELY TO ACHIEVE PROFIT OR LOSSES SIMILAR TO THOSE SHOWN