
Markets

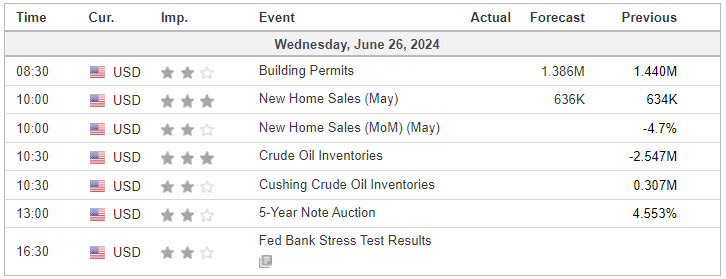
Economic Calendar
S&P 500

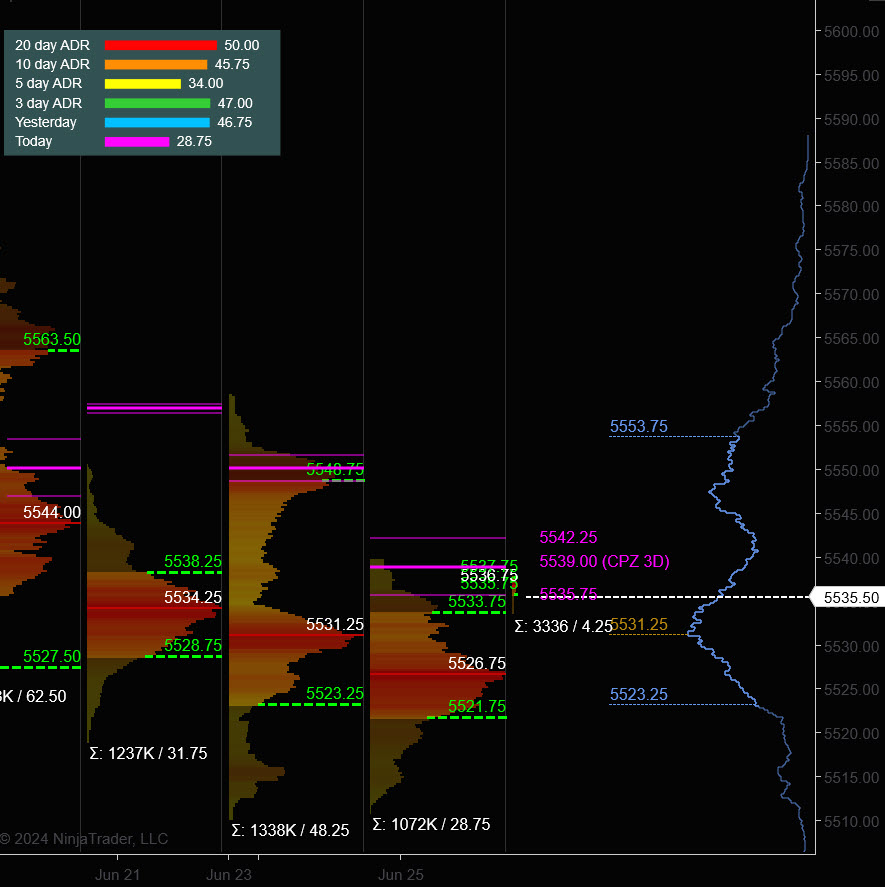
Prior Session was Cycle Day 2: Market successfully retested the CD1 Low (5510.25) during the RTH starting this cycle’s rally. Range for ES was 28 handles on 1.072M contracts exchanged.
…Transition from Cycle Day 2 to Cycle Day 3
This leads us into Cycle Day 3: There remains plenty of room for this cycle’s rally to continue, targeting 5552 handle. We’ll be monitoring for a conversion above 5540 level with a sustained bid for this session. Weakness below 5520 places this cycle’s rally in jeopardy of completing. You Know The Plan! Our discipline of maintaining positioning that is aligned with market forces continues to serve us well, so stay the course.
As such, scenarios to consider for today’s trading.
Bull Scenario: Price sustains a bid above 5540, initially targets 5550 – 5555 zone.
Bear Scenario: Price sustains an offer below 5540, initially targets 5525 – 5520 zone.
PVA High Edge = 5533 PVA Low Edge = 5522 Prior POC = 5526
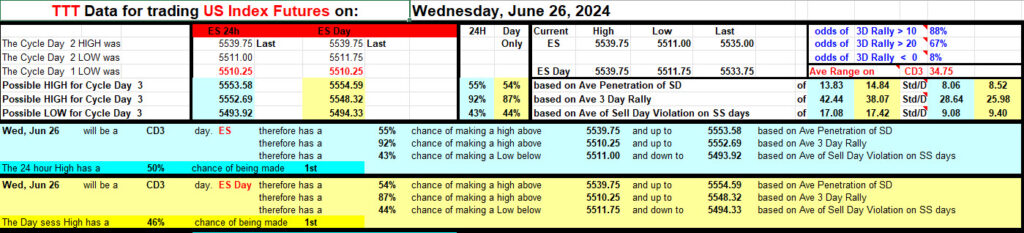
PTG 3 Day Cycle
EXCLUSIVE OFFER

*****The 3 Day Cycle has a 92.50% probability of fulfilling Positive Cycle Statistics covering 12 years of recorded tracking history.
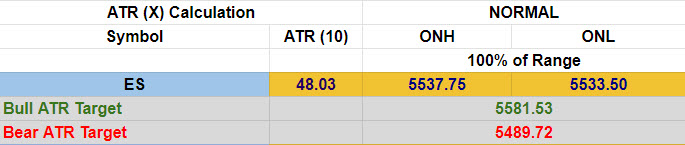
Link to: Dynamic Range Projections (ES) Sept (U) 2024
ES Chart
Nasdaq 100 (NQ)

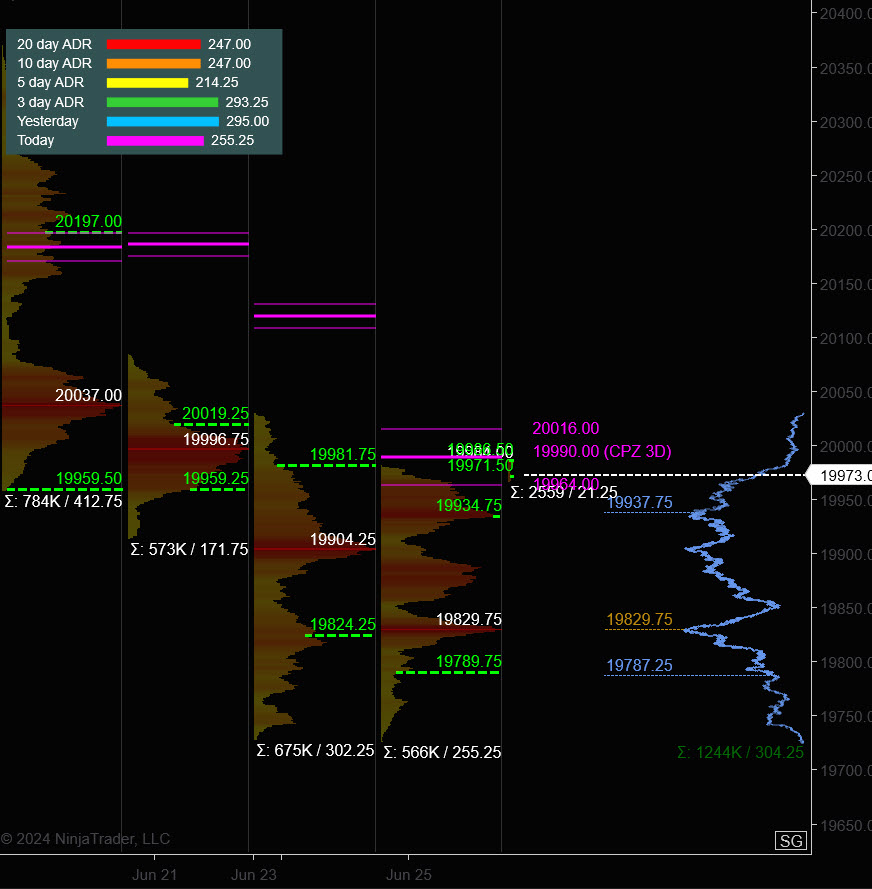
Prior Session was Cycle Day 2: CD1 Low (19728) was never retested as buyers maintained control above Open Range and Initial Balance Midpoint (19845), closing near highs. Range for NQ was 255 handles on 566k contracts exchanged.
…Transition from Cycle Day 2 to Cycle Day 3
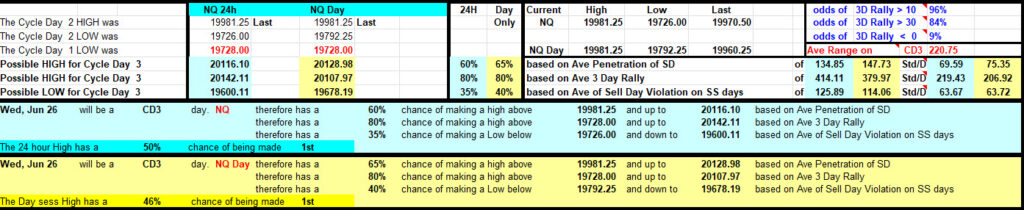
This leads us into Cycle Day 3: There remains plenty of room for this cycle’s rally to continue, targeting 20142 handle. We’ll be monitoring for a conversion above 20025 level with a sustained bid for this session. Weakness below 19855 places this cycle’s rally in jeopardy of completing. You Know The Plan! Our discipline of maintaining positioning that is aligned with market forces continues to serve us well, so stay the course.
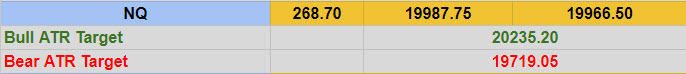
Bull Scenario: Price sustains a bid above 19960, initially targets 20116 – 20145 zone.
Bear Scenario: Price sustains an offer below 19960, initially targets 19855 – 19830 zone.
PVA High Edge = 19935 PVA Low Edge = 19790 Prior POC = 19830
Link to: Dynamic Range Projections (NQ) Sept (U) 2024
NQ Chart
Trade Strategy: Our tactical trade strategy will simply remain unaltered…We’ll be flexible to trade both long and short side from Decision Pivot Levels. Continue to focus on Bull/Bear Stackers and Premium/Discounts. As always, remaining in alignment with dominant intra-day force increases probabilities of producing winning trades.
Stay Focused…Non-Biased…Disciplined ALWAYS USE STOPS!
Good Trading…David
“Knowing is not enough, We must APPLY. Willing is not enough, We must DO.” –BR
*****This trade strategy report is disseminated for “education only” and should not be viewed in any way as a recommendation to buy or sell futures products.”
PAST PERFORMANCE IS NOT NECESSARILY INDICATIVE OF FUTURE RESULTS
IMPORTANT NOTICE! No representation is being made that the use of this strategy or any system or trading methodology will generate profits. Past performance is not necessarily indicative of future results. There is substantial risk of loss associated with trading securities and options on equities. Only risk capital should be used to trade. Trading securities is not suitable for everyone.
Disclaimer: Futures, Options, and Currency trading all have large potential rewards, but they also have large potential risk. You must be aware of the risks and be willing to accept them in order to invest in these markets. Don’t trade with money you can’t afford to lose.
This website is neither a solicitation nor an offer to Buy/Sell futures, options, or currencies. No representation is being made that any account will or is likely to achieve profits or losses similar to those discussed on this web site. The past performance of any trading system or methodology is not necessarily indicative of future results.
CFTC RULE 4.41 –HYPOTHETICAL OR SIMULATED PERFORMANCE RESULTS HAVE CERTAIN LIMITATIONS. UNLIKE AN ACTUAL PERFORMANCE RECORD, SIMULATED RESULTS DO NOT REPRESENT ACTUAL TRADING. ALSO, SINCE THE TRADES HAVE NOT BEEN EXECUTED, THE RESULTS MAY HAVE UNDER-OR-OVER COMPENSATED FOR THE IMPACT, IF ANY, OF CERTAIN MARKET FACTORS, SUCH AS LACK OF LIQUIDITY. SIMULATED TRADING PROGRAMS IN GENERAL ARE ALSO SUBJECT TO THE FACT THAT THEY ARE DESIGNED WITH THE BENEFIT OF HINDSIGHT. NO REPRESENTATION IS BEING MADE THAT ANY ACCOUNT WILL OR IS LIKELY TO ACHIEVE PROFIT OR LOSSES SIMILAR TO THOSE SHOWN