
Markets

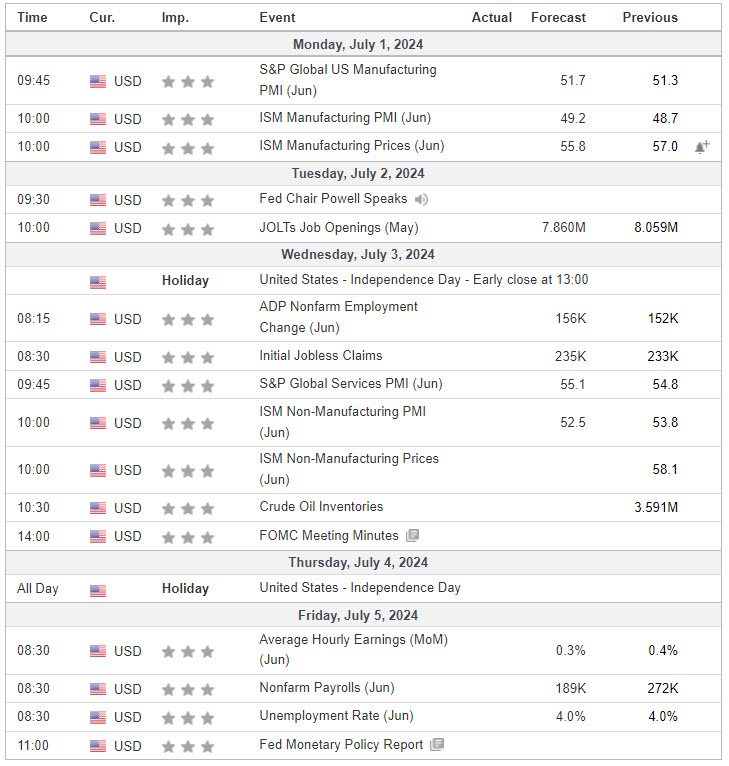
Economic Calendar
S&P 500

Prior Session was Cycle Day 2: The expected end of month/quarter “window dressing” unfolded in fine fashion, as upside target 5585 tagged “to-the-tick as outlined in prior DTS Briefing 6.28.24. Market on Close volatility pushed price down to retest 5515, this cycle’s low, where there was a strong buy response, closing 5532.25. Range for ES was 74 handles on 1.714M contracts exchanged.
…Transition from Cycle Day 2 to Cycle Day 3
This leads us into Cycle Day 3: Cycle targets have been achieved, so as long as price trades above CD1 Low (5515.75), Positive 3-Day Cycle will be satisfied.
This week is another shortened trading schedule, with 4th of July Thursday, as many traders will be taking extended holiday weekend. Also, this week’s Economic Calendar is loaded, so be prepared and flexible on all fronts. Finally, today’s charts are multi-day composite profiles which outline the key levels both bulls and bears would need to overcome for the next directional breakout. Be mindful and have a “plan-of-action” for either scenario.
You Know The Plan! Our discipline of maintaining positioning that is aligned with market forces continues to serve us well, so stay the course.
As such, scenarios to consider for today’s trading.
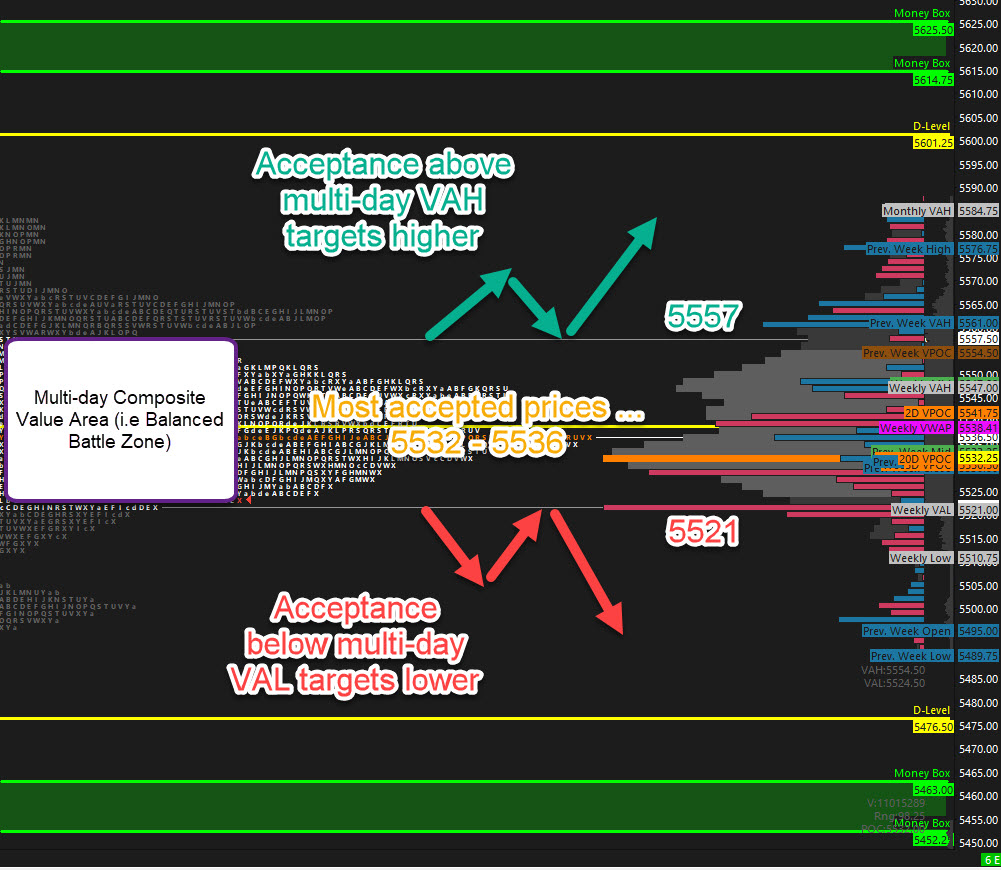
Bull Scenario: Price sustains a bid above 5532, initially targets 5550 – 5555 zone.
Bear Scenario: Price sustains an offer below 5532, initially targets 5520 – 5515 zone.
PVA High Edge = 5569 PVA Low Edge = 5529 Prior POC = 5531
PTG 3 Day Cycle
EXCLUSIVE OFFER

*****The 3 Day Cycle has a 92.48% probability of fulfilling Positive Cycle Statistics covering 12 years of recorded tracking history.
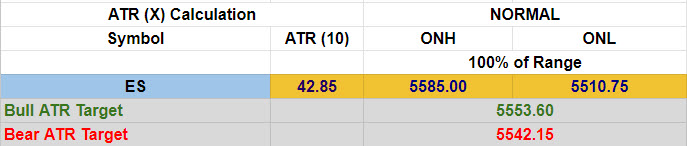
Link to: Dynamic Range Projections (ES) Sept (U) 2024
ES Chart
Nasdaq 100 (NQ)

Prior Session was Cycle Day 2: The expected end of month/quarter “window dressing” unfolded in fine fashion, as upside target 20255 was fulfilled as outlined in prior DTS Briefing 6.28.24. Market on Close volatility pushed price down to 19906, holding above this cycle’s low (19874.25), with a strong buy response. Range for NQ was 367 handles on 737k contracts exchanged.
…Transition from Cycle Day 2 to Cycle Day 3
This leads us into Cycle Day 3: Cycle targets have been achieved, so as long as price trades above CD1 Low (19874.25), Positive 3-Day Cycle will be satisfied.
This week is another shortened trading schedule, with 4th of July Thursday, as many traders will be taking extended holiday weekend. Also, this week’s Economic Calendar is loaded, so be prepared and flexible on all fronts. Finally, today’s charts are multi-day composite profiles which outline the key levels both bulls and bears would need to overcome for the next directional breakout. Be mindful and have a “plan-of-action” for either scenario.
You Know The Plan! Our discipline of maintaining positioning that is aligned with market forces continues to serve us well, so stay the course.
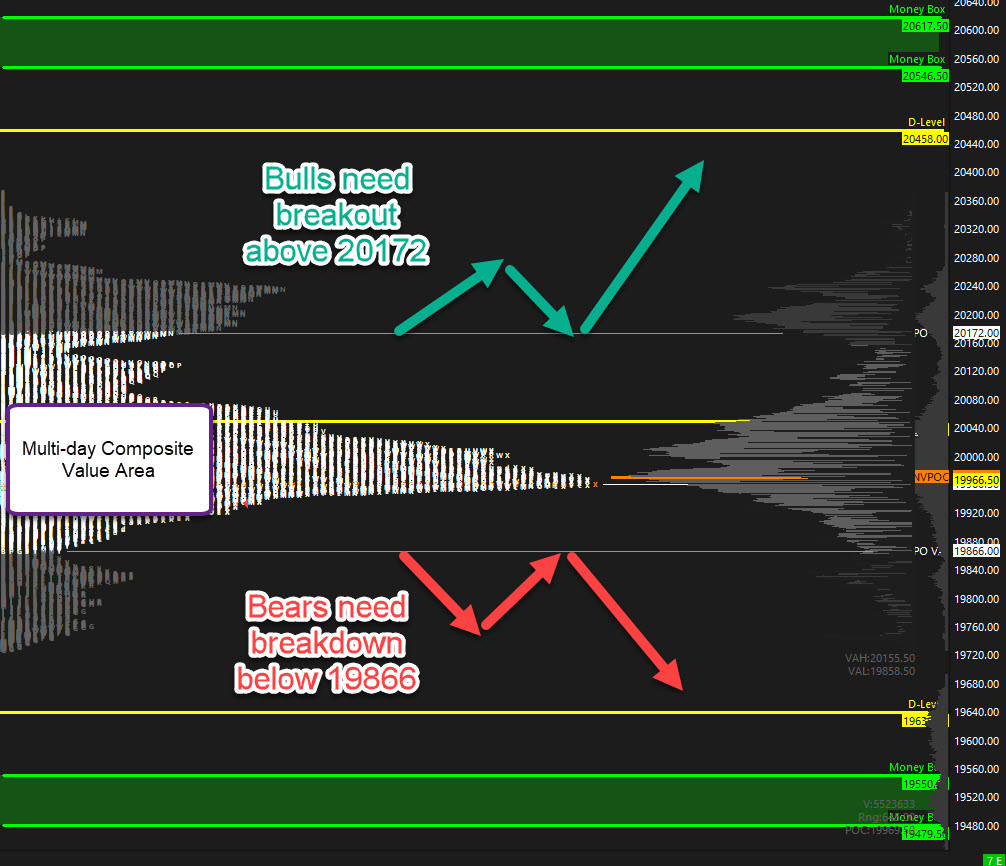
Bull Scenario: Price sustains a bid above 19962, initially targets 20020 – 20045 zone.
Bear Scenario: Price sustains an offer below 19962, initially targets 19906 – 19874 zone.
PVA High Edge = 19988 PVA Low Edge = 19948 Prior POC = 19958
Link to: Dynamic Range Projections (NQ) Sept (U) 2024

NQ Chart
Trade Strategy: Our tactical trade strategy will simply remain unaltered…We’ll be flexible to trade both long and short side from Decision Pivot Levels. Continue to focus on Bull/Bear Stackers and Premium/Discounts. As always, remaining in alignment with dominant intra-day force increases probabilities of producing winning trades.
Stay Focused…Non-Biased…Disciplined ALWAYS USE STOPS!
Good Trading…David
“Knowing is not enough, We must APPLY. Willing is not enough, We must DO.” –BR
*****This trade strategy report is disseminated for “education only” and should not be viewed in any way as a recommendation to buy or sell futures products.”
PAST PERFORMANCE IS NOT NECESSARILY INDICATIVE OF FUTURE RESULTS
IMPORTANT NOTICE! No representation is being made that the use of this strategy or any system or trading methodology will generate profits. Past performance is not necessarily indicative of future results. There is substantial risk of loss associated with trading securities and options on equities. Only risk capital should be used to trade. Trading securities is not suitable for everyone.
Disclaimer: Futures, Options, and Currency trading all have large potential rewards, but they also have large potential risk. You must be aware of the risks and be willing to accept them in order to invest in these markets. Don’t trade with money you can’t afford to lose.
This website is neither a solicitation nor an offer to Buy/Sell futures, options, or currencies. No representation is being made that any account will or is likely to achieve profits or losses similar to those discussed on this web site. The past performance of any trading system or methodology is not necessarily indicative of future results.
CFTC RULE 4.41 –HYPOTHETICAL OR SIMULATED PERFORMANCE RESULTS HAVE CERTAIN LIMITATIONS. UNLIKE AN ACTUAL PERFORMANCE RECORD, SIMULATED RESULTS DO NOT REPRESENT ACTUAL TRADING. ALSO, SINCE THE TRADES HAVE NOT BEEN EXECUTED, THE RESULTS MAY HAVE UNDER-OR-OVER COMPENSATED FOR THE IMPACT, IF ANY, OF CERTAIN MARKET FACTORS, SUCH AS LACK OF LIQUIDITY. SIMULATED TRADING PROGRAMS IN GENERAL ARE ALSO SUBJECT TO THE FACT THAT THEY ARE DESIGNED WITH THE BENEFIT OF HINDSIGHT. NO REPRESENTATION IS BEING MADE THAT ANY ACCOUNT WILL OR IS LIKELY TO ACHIEVE PROFIT OR LOSSES SIMILAR TO THOSE SHOWN