
Markets

Economic Calendar
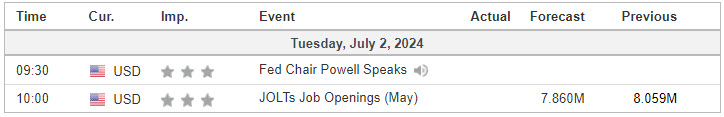
Source: Investing.com
S&P 500

Prior Session was Cycle Day 3: Positive Three-Day Cycle was fulfilled with a 92.48% success-rate covering twelve-plus years of tracking history. This session was effectively a balancing day as price is currently confined within a multi-day composite consolidation pattern. Range for ES was 36 handles which matches the average range for CD3 on 1.351M contracts exchanged.
…Transition from Cycle Day 3 to Cycle Day 1
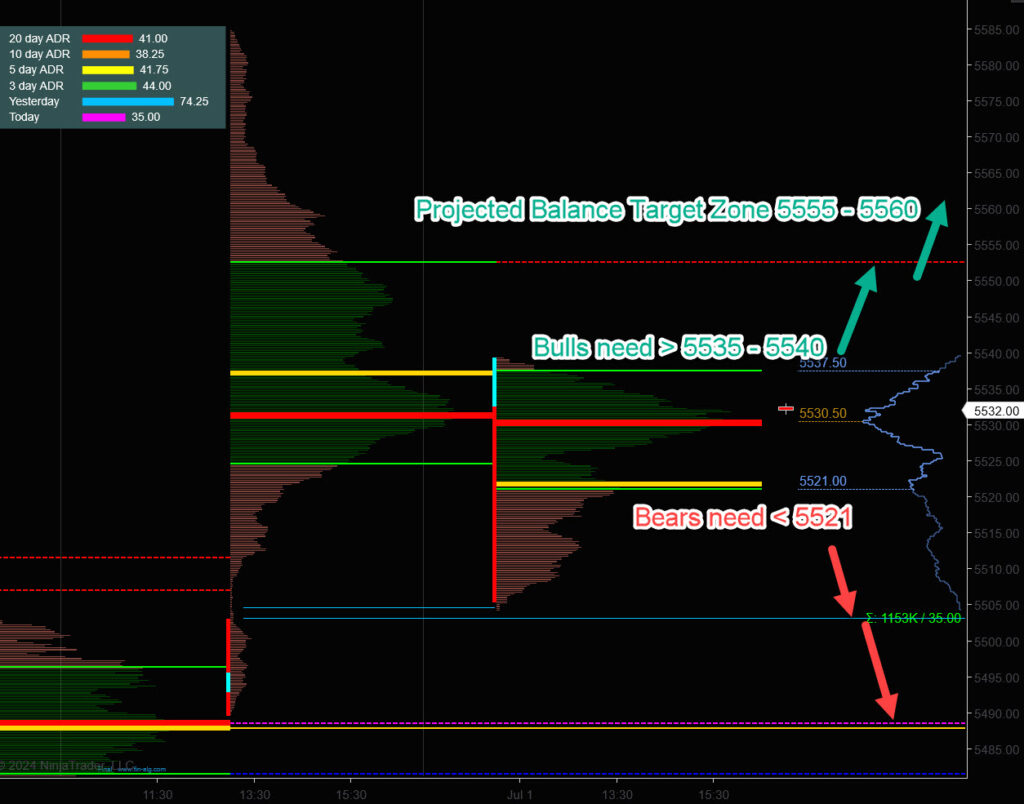
This leads us into Cycle Day 1: Today begins a new cycle with the average decline measuring between the 5505 (primary) – 5488 (secondary) levels. Daily profile hints at bullish imbalance should price clear above 5535 – 5540 zone, with a Projected Balance Target Zone of 5555 – 5560. Our discipline of maintaining positioning that is aligned with market forces continues to serve us well, so stay the course.
As such, scenarios to consider for today’s trading.
Bull Scenario: Price sustains a bid above 5530, initially targets 5555 – 5560 zone.
Bear Scenario: Price sustains an offer below 5530, initially targets 5515 – 5505 zone.
PVA High Edge = 5538 PVA Low Edge = 5522 Prior POC = 5532
PTG 3 Day Cycle
EXCLUSIVE OFFER

*****The 3 Day Cycle has a 92.48% probability of fulfilling Positive Cycle Statistics covering 12 years of recorded tracking history.
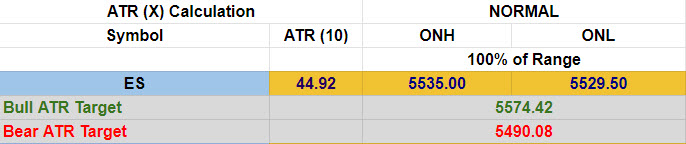
Link to: Range Projections (ES) Sept (U) 2024
ES Chart
Nasdaq 100 (NQ)

Prior Session was Cycle Day 3: Positive Three-Day Cycle was fulfilled with a 92.48% success-rate covering twelve-plus years of tracking history. This session was effectively a balancing day as price declined to today’s CD1 average decline (19837) where a strong buy response developed, rejecting the low and pushing back higher on the day. Range for NQ was 262 handles which matches the 10-day average range on 631k contracts exchanged.
…Transition from Cycle Day 3 to Cycle Day 1
This leads us into Cycle Day 1: Today begins a new cycle with the average decline measuring 19837 which has been fulfilled during prior session. We will still need to monitor today’s session for the actual CD1 low print. Our discipline of maintaining positioning that is aligned with market forces continues to serve us well, so stay the course.
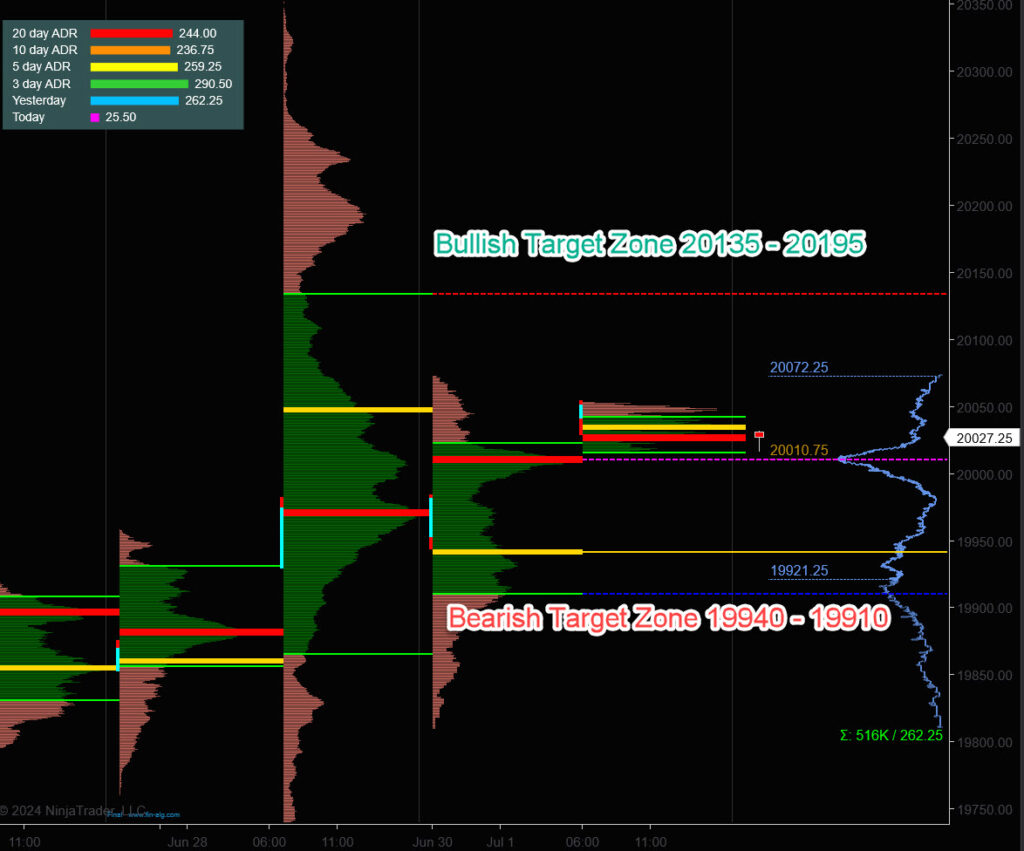
Bull Scenario: Price sustains a bid above 20010, initially targets 20135 – 20195 zone.
Bear Scenario: Price sustains an offer below 20010, initially targets 19940 – 19910 zone.
PVA High Edge = 20022 PVA Low Edge = 19909 Prior POC = 20010
Link to: Range Projections (NQ) Sept (U) 2024

NQ Chart
Trade Strategy: Our tactical trade strategy will simply remain unaltered…We’ll be flexible to trade both long and short side from Decision Pivot Levels. Continue to focus on Bull/Bear Stackers and Premium/Discounts. As always, remaining in alignment with dominant intra-day force increases probabilities of producing winning trades.
Stay Focused…Non-Biased…Disciplined ALWAYS USE STOPS!
Good Trading…David
“Knowing is not enough, We must APPLY. Willing is not enough, We must DO.” –BR
*****This trade strategy report is disseminated for “education only” and should not be viewed in any way as a recommendation to buy or sell futures products.”
PAST PERFORMANCE IS NOT NECESSARILY INDICATIVE OF FUTURE RESULTS
IMPORTANT NOTICE! No representation is being made that the use of this strategy or any system or trading methodology will generate profits. Past performance is not necessarily indicative of future results. There is substantial risk of loss associated with trading securities and options on equities. Only risk capital should be used to trade. Trading securities is not suitable for everyone.
Disclaimer: Futures, Options, and Currency trading all have large potential rewards, but they also have large potential risk. You must be aware of the risks and be willing to accept them in order to invest in these markets. Don’t trade with money you can’t afford to lose.
This website is neither a solicitation nor an offer to Buy/Sell futures, options, or currencies. No representation is being made that any account will or is likely to achieve profits or losses similar to those discussed on this web site. The past performance of any trading system or methodology is not necessarily indicative of future results.
CFTC RULE 4.41 –HYPOTHETICAL OR SIMULATED PERFORMANCE RESULTS HAVE CERTAIN LIMITATIONS. UNLIKE AN ACTUAL PERFORMANCE RECORD, SIMULATED RESULTS DO NOT REPRESENT ACTUAL TRADING. ALSO, SINCE THE TRADES HAVE NOT BEEN EXECUTED, THE RESULTS MAY HAVE UNDER-OR-OVER COMPENSATED FOR THE IMPACT, IF ANY, OF CERTAIN MARKET FACTORS, SUCH AS LACK OF LIQUIDITY. SIMULATED TRADING PROGRAMS IN GENERAL ARE ALSO SUBJECT TO THE FACT THAT THEY ARE DESIGNED WITH THE BENEFIT OF HINDSIGHT. NO REPRESENTATION IS BEING MADE THAT ANY ACCOUNT WILL OR IS LIKELY TO ACHIEVE PROFIT OR LOSSES SIMILAR TO THOSE SHOWN