
Markets

Wall Street posted its worst week since mid-April, as a rotation out of technology stocks sparked by last Thursday’s consumer inflation report continued over the past few days. For the week, the Nasdaq (COMP:IND) was down 3.65% and the S&P (SP500) off 1.96%. Conversely, the Dow (DJI) was up 0.72% The primary driver of this week’s loss in the S&P 500 (SP500) was a continued rotation out of technology stocks. The unwinding of the “tech trade” was sparked by last Thursday’s soft consumer inflation report.
Source: Seeking Alpha
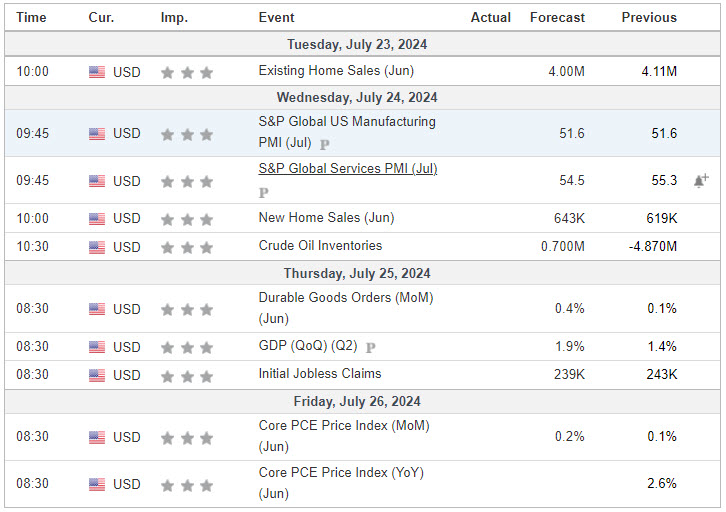
Economic Calendar
S&P 500

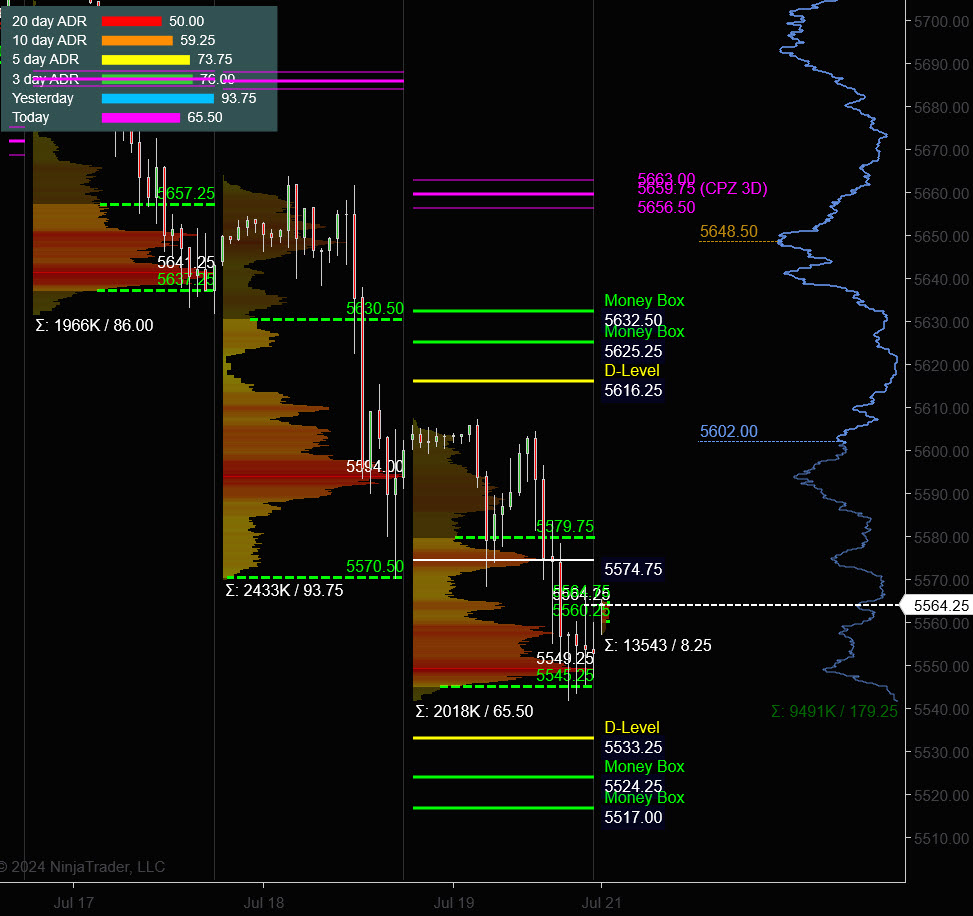
Prior Session was Cycle Day 2: Markets continued their corrective decline ending a week of long liquidation. Range was 65 handles on 2.018M contracts exchanged.
…Transition from Cycle Day 2 to Cycle Day 3
This leads us into Cycle Day 3: Price closed below the CD1 Low (5570.25) with high historical odds (91%) of recovering this level to secure a positive 3-day cycle statistic. Bulls must squelch any further selling to stop the “bleed” and recover the CD1 Low at minimum. IF successful, THEN a case can be made for reclaiming 5617 handle. But caution is warranted, so do not get over your skis. Stay focused and disciplined to your $risk management.
You Know The Plan! Our discipline of maintaining positioning that is aligned with market forces continues to serve us well, so stay the course.
As such, scenarios to consider for today’s trading.
Bull Scenario: Price sustains a bid above 5560, initially targets 5575 – 5580 zone.
Bear Scenario: Price sustains an offer below 5560, initially targets 5540 – 5535 zone.
PVA High Edge = 5580 PVA Low Edge = 5545 Prior POC = 5550
PTG 3 Day Cycle
EXCLUSIVE OFFER

*****The 3 Day Cycle has a 91.49% probability of fulfilling Positive Cycle Statistics covering 12 years of recorded tracking history.
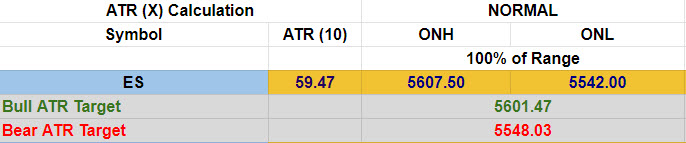
Link to: Dynamic Range Projections (ES) Sept (U) 2024
ES Chart
Nasdaq 100 (NQ)

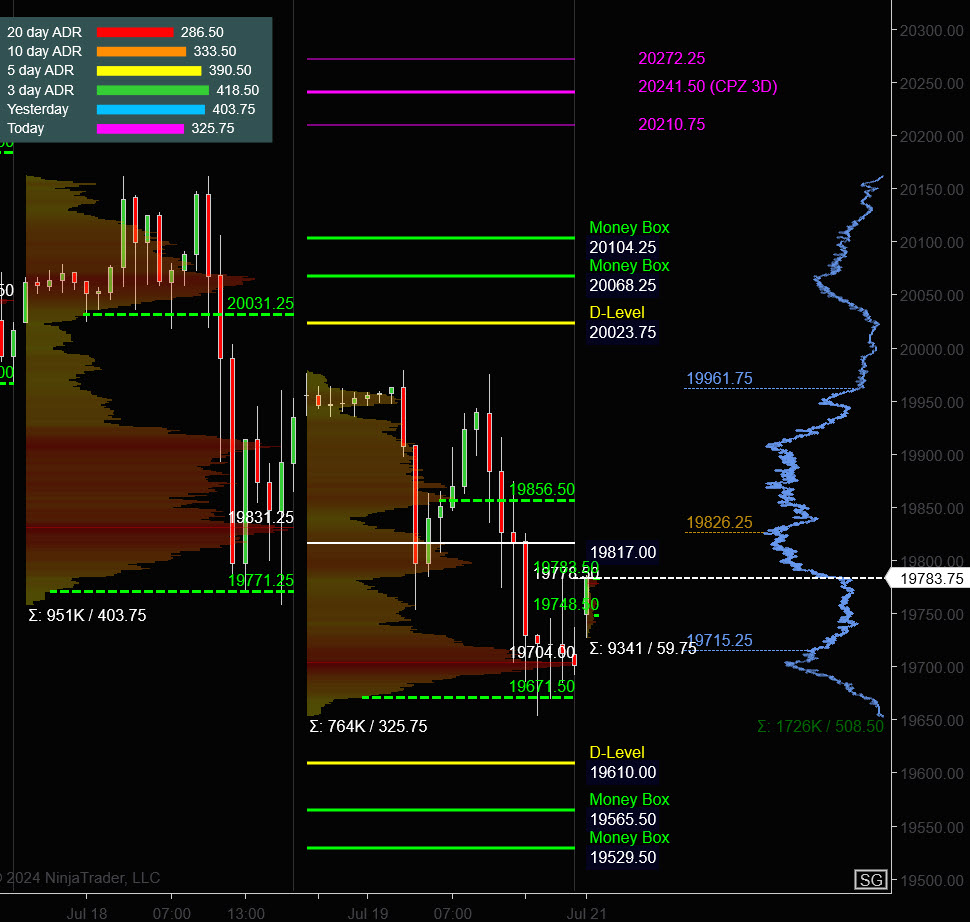
Prior Session was Cycle Day 2: Markets continued their corrective decline ending a week of long liquidation. Range was 325 handles on 764k contracts exchanged.
…Transition from Cycle Day 2 to Cycle Day 3
This leads us into Cycle Day 3: Price closed below the CD1 Low (19758.75) with high historical odds (91%) of recovering this level to secure a positive 3-day cycle statistic. Bulls must squelch any further selling to stop the “bleed” and recover the CD1 Low at minimum. IF successful, THEN a case can be made for reclaiming 19962 handle. But caution is warranted, so do not get over your skis. Stay focused and disciplined to your $risk management.
You Know The Plan! Our discipline of maintaining positioning that is aligned with market forces continues to serve us well, so stay the course.
As such, scenarios to consider for today’s trading.
Bull Scenario: Price sustains a bid above 19715, initially targets 19826 – 19856 zone.
Bear Scenario: Price sustains an offer below 19715, initially targets 19671 – 19652 zone.
PVA High Edge = 19856 PVA Low Edge = 19671 Prior POC = 19704
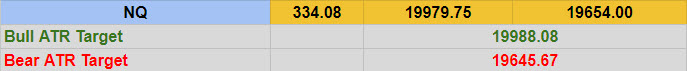
Link to: Dynamic Range Projections (NQ) Sept (U) 2024
NQ Chart
Trade Strategy: Our tactical trade strategy will simply remain unaltered…We’ll be flexible to trade both long and short side from Decision Pivot Levels. Continue to focus on Bull/Bear Stackers and Premium/Discounts. As always, remaining in alignment with dominant intra-day force increases probabilities of producing winning trades.
Stay Focused…Non-Biased…Disciplined ALWAYS USE STOPS!
Good Trading…David
“Knowing is not enough, We must APPLY. Willing is not enough, We must DO.” –BR
*****This trade strategy report is disseminated for “education only” and should not be viewed in any way as a recommendation to buy or sell futures products.”
PAST PERFORMANCE IS NOT NECESSARILY INDICATIVE OF FUTURE RESULTS
IMPORTANT NOTICE! No representation is being made that the use of this strategy or any system or trading methodology will generate profits. Past performance is not necessarily indicative of future results. There is substantial risk of loss associated with trading securities and options on equities. Only risk capital should be used to trade. Trading securities is not suitable for everyone.
Disclaimer: Futures, Options, and Currency trading all have large potential rewards, but they also have large potential risk. You must be aware of the risks and be willing to accept them in order to invest in these markets. Don’t trade with money you can’t afford to lose.
This website is neither a solicitation nor an offer to Buy/Sell futures, options, or currencies. No representation is being made that any account will or is likely to achieve profits or losses similar to those discussed on this web site. The past performance of any trading system or methodology is not necessarily indicative of future results.
CFTC RULE 4.41 –HYPOTHETICAL OR SIMULATED PERFORMANCE RESULTS HAVE CERTAIN LIMITATIONS. UNLIKE AN ACTUAL PERFORMANCE RECORD, SIMULATED RESULTS DO NOT REPRESENT ACTUAL TRADING. ALSO, SINCE THE TRADES HAVE NOT BEEN EXECUTED, THE RESULTS MAY HAVE UNDER-OR-OVER COMPENSATED FOR THE IMPACT, IF ANY, OF CERTAIN MARKET FACTORS, SUCH AS LACK OF LIQUIDITY. SIMULATED TRADING PROGRAMS IN GENERAL ARE ALSO SUBJECT TO THE FACT THAT THEY ARE DESIGNED WITH THE BENEFIT OF HINDSIGHT. NO REPRESENTATION IS BEING MADE THAT ANY ACCOUNT WILL OR IS LIKELY TO ACHIEVE PROFIT OR LOSSES SIMILAR TO THOSE SHOWN