
US Market Wrap
Big Tech Drags Down the Markets as Earnings Get Underway

Wall Street received a reality check after a disappointing start to the mega-cap earnings season raised concerns that the artificial intelligence frenzy that has propelled the bull market may be overblown.
The world’s largest technology companies drove the S&P 500 down 2.3%, marking the worst selloff since December 2022. The Nasdaq 100 suffered more significant losses, falling nearly 4%. Alphabet fell 5% after allocating more resources to its AI push, with spending exceeding analysts’ expectations. Tesla’s profit miss and Robo-taxi delay prompted a 12% stock drop.
Wednesday’s session was another example of the “concentration risk” that bears see in a market where the upside has been disproportionately attributed to a small group of massive gainers. For the fourth consecutive session, and the tenth time in 11 days, smaller companies outperformed larger ones, indicating that investor preferences have shifted away from the mega-cap tech names that have come to dominate benchmark indexes.
Source: Financial Juice
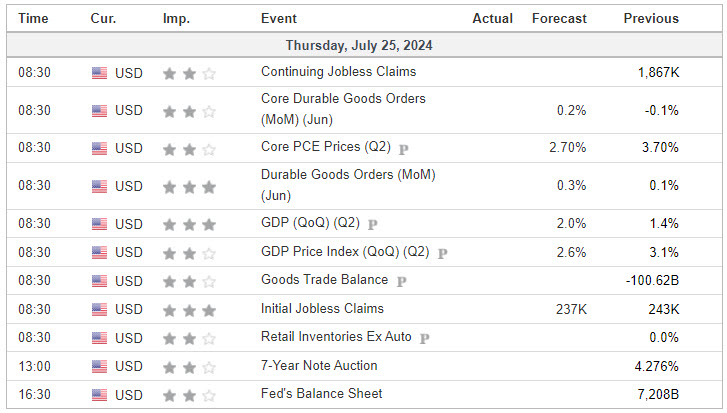
Economic Calendar
S&P 500

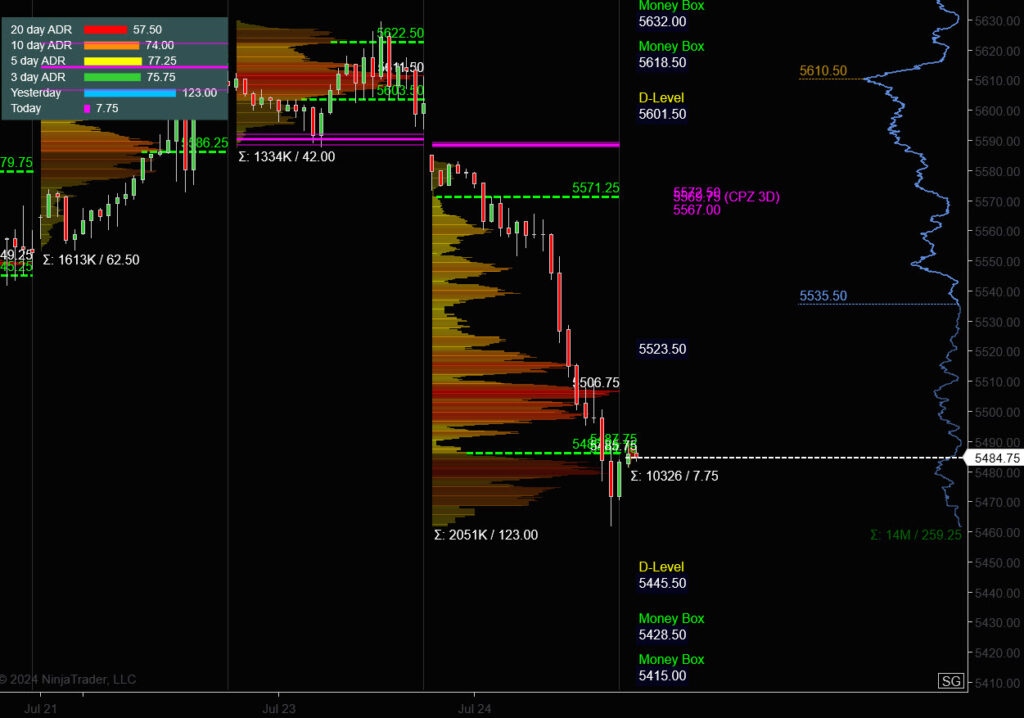
Prior Session was Cycle Day 2: Markets continued their corrective One-Sigma Weekly Decline dropping in excess of 120 handles as BIG Cap Tech Long Liquidation accelerated. Range was 123 handles (twice the 10-day average) on 2.051M contracts exchanged.
…Transition from Cycle Day 2 to Cycle Day 3
This leads us into Cycle Day 3: Price closed below the CD1 Low (5587.75) with high historical odds (91%) of recovering this level to secure a positive 3-day cycle statistic. BUT, I must add, that this is a steep hill to climb for a full-recovery, given the recent selling momentum. Partial recovery off the closing low (5462) targets 5516 – 5538. Stay focused and disciplined to your $risk management.
You Know The Plan! Our discipline of maintaining positioning that is aligned with market forces continues to serve us well, so stay the course.
As such, scenarios to consider for today’s trading.
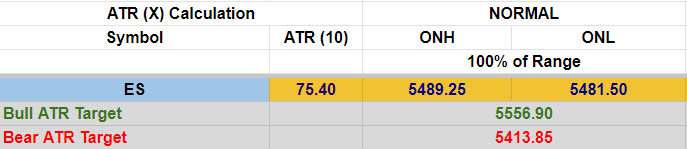
Bull Scenario: Price sustains a bid above 5485, initially targets 5516 – 5538 zone.
Bear Scenario: Price sustains an offer below 5485, initially targets 5460 – 5450 zone.
PVA High Edge = 5571 PVA Low Edge = 5485 Prior POC = 5507
PTG 3 Day Cycle
EXCLUSIVE OFFER

*****The 3 Day Cycle has a 91.67% probability of fulfilling Positive Cycle Statistics covering 12 years of recorded tracking history.
Link to: Dynamic Range Projections (ES) Sept (U) 2024
ES Chart
Nasdaq 100 (NQ)

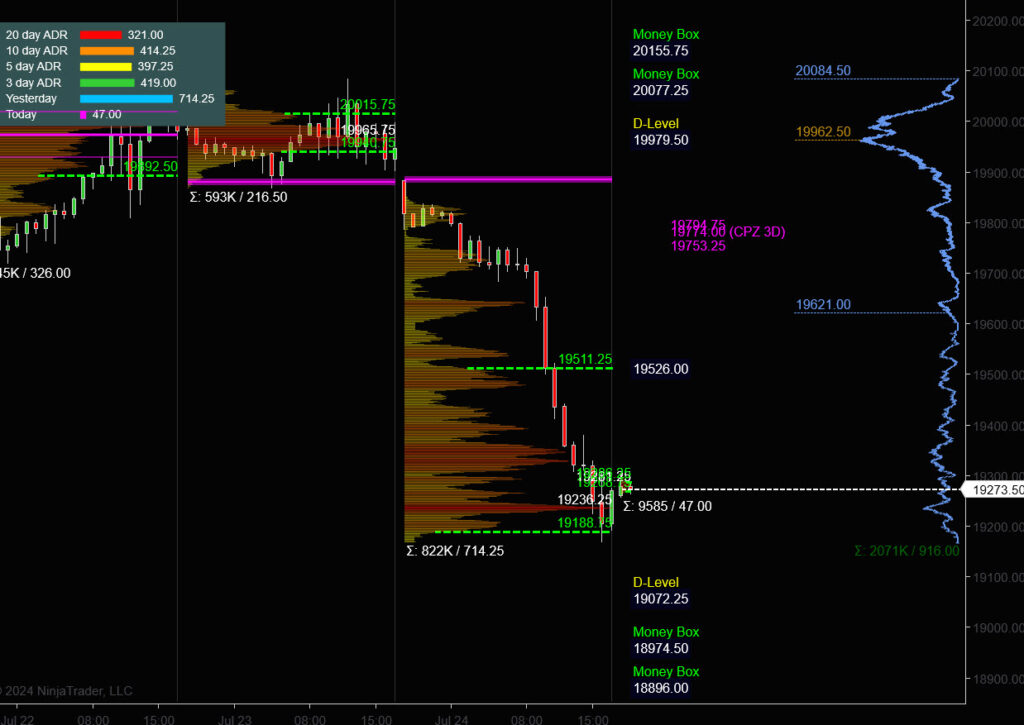
Prior Session was Cycle Day 2: Markets continued their corrective decline dropping in excess of 700 handles as BIG Cap Tech Long Liquidation accelerated. Range was 714 handles (twice the 20-day average) on 822k contracts exchanged.
…Transition from Cycle Day 2 to Cycle Day 3
This leads us into Cycle Day 3: Price closed below the CD1 Low (19868.25) with high historical odds (91%) of recovering this level to secure a positive 3-day cycle statistic. BUT, I must add, that this is a steep hill to climb for a full-recovery, given the recent selling momentum. Partial recovery off the closing low (19168.75) targets 19478.25. Stay focused and disciplined to your $risk management.
You Know The Plan! Our discipline of maintaining positioning that is aligned with market forces continues to serve us well, so stay the course.
As such, scenarios to consider for today’s trading.
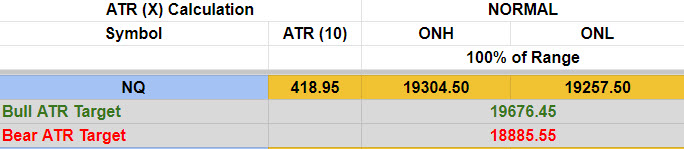
Bull Scenario: Price sustains a bid above 19260, initially targets 19359 – 19458 zone.
Bear Scenario: Price sustains an offer below 19260, initially targets 19160 – 19110 zone.
PVA High Edge = 19511 PVA Low Edge = 19188 Prior POC = 19236
Link to: Dynamic Range Projections (NQ) Sept (U) 2024
NQ Chart
Trade Strategy: Our tactical trade strategy will simply remain unaltered…We’ll be flexible to trade both long and short side from Decision Pivot Levels. Continue to focus on Bull/Bear Stackers and Premium/Discounts. As always, remaining in alignment with dominant intra-day force increases probabilities of producing winning trades.
Stay Focused…Non-Biased…Disciplined ALWAYS USE STOPS!
Good Trading…David
“Knowing is not enough, We must APPLY. Willing is not enough, We must DO.” –BR
*****This trade strategy report is disseminated for “education only” and should not be viewed in any way as a recommendation to buy or sell futures products.”
PAST PERFORMANCE IS NOT NECESSARILY INDICATIVE OF FUTURE RESULTS
IMPORTANT NOTICE! No representation is being made that the use of this strategy or any system or trading methodology will generate profits. Past performance is not necessarily indicative of future results. There is substantial risk of loss associated with trading securities and options on equities. Only risk capital should be used to trade. Trading securities is not suitable for everyone.
Disclaimer: Futures, Options, and Currency trading all have large potential rewards, but they also have large potential risk. You must be aware of the risks and be willing to accept them in order to invest in these markets. Don’t trade with money you can’t afford to lose.
This website is neither a solicitation nor an offer to Buy/Sell futures, options, or currencies. No representation is being made that any account will or is likely to achieve profits or losses similar to those discussed on this web site. The past performance of any trading system or methodology is not necessarily indicative of future results.
CFTC RULE 4.41 –HYPOTHETICAL OR SIMULATED PERFORMANCE RESULTS HAVE CERTAIN LIMITATIONS. UNLIKE AN ACTUAL PERFORMANCE RECORD, SIMULATED RESULTS DO NOT REPRESENT ACTUAL TRADING. ALSO, SINCE THE TRADES HAVE NOT BEEN EXECUTED, THE RESULTS MAY HAVE UNDER-OR-OVER COMPENSATED FOR THE IMPACT, IF ANY, OF CERTAIN MARKET FACTORS, SUCH AS LACK OF LIQUIDITY. SIMULATED TRADING PROGRAMS IN GENERAL ARE ALSO SUBJECT TO THE FACT THAT THEY ARE DESIGNED WITH THE BENEFIT OF HINDSIGHT. NO REPRESENTATION IS BEING MADE THAT ANY ACCOUNT WILL OR IS LIKELY TO ACHIEVE PROFIT OR LOSSES SIMILAR TO THOSE SHOWN