
Markets
The S&P 500 (GSPC) and Nasdaq Composite (^IXIC) recently had their worst single-day drops since 2022 as the indexes struggled to recover losses during a Friday rally. All three major averages closed the final full week of July lower. The S&P 500 was down more than 1%, while the Nasdaq fell over 2.3%. Meanwhile, the Dow Jones Industrial Average (DJI) rose about 0.6%.

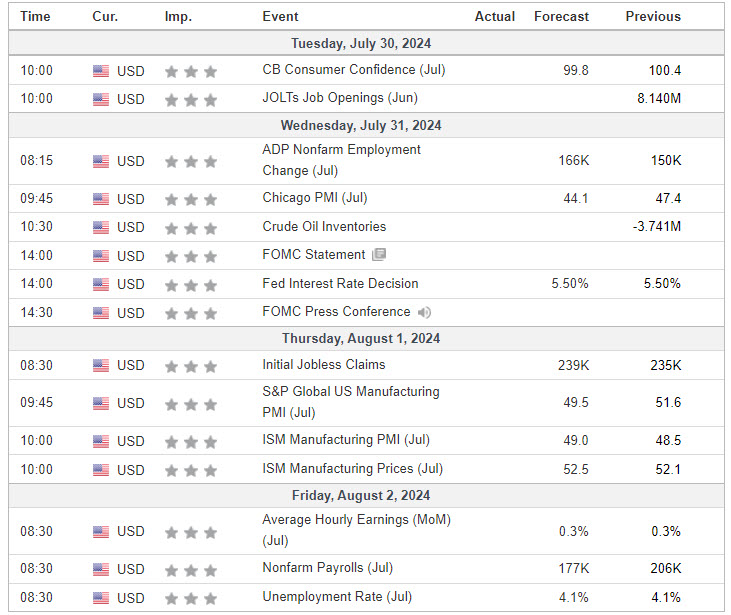
In the week ahead, a Federal Reserve meeting, the July jobs report, and earnings from Big Tech stalwarts Apple (AAPL), Amazon (AMZN), Microsoft (MSFT), and Meta (META) will drive the direction of markets to kick off August.
A September ‘signal’
The Fed will announce its latest monetary policy decision next Wednesday. Markets largely expect the central bank to hold rates steady at its July meeting.
Source: Yahoo Finance
Economic Calendar
S&P 500

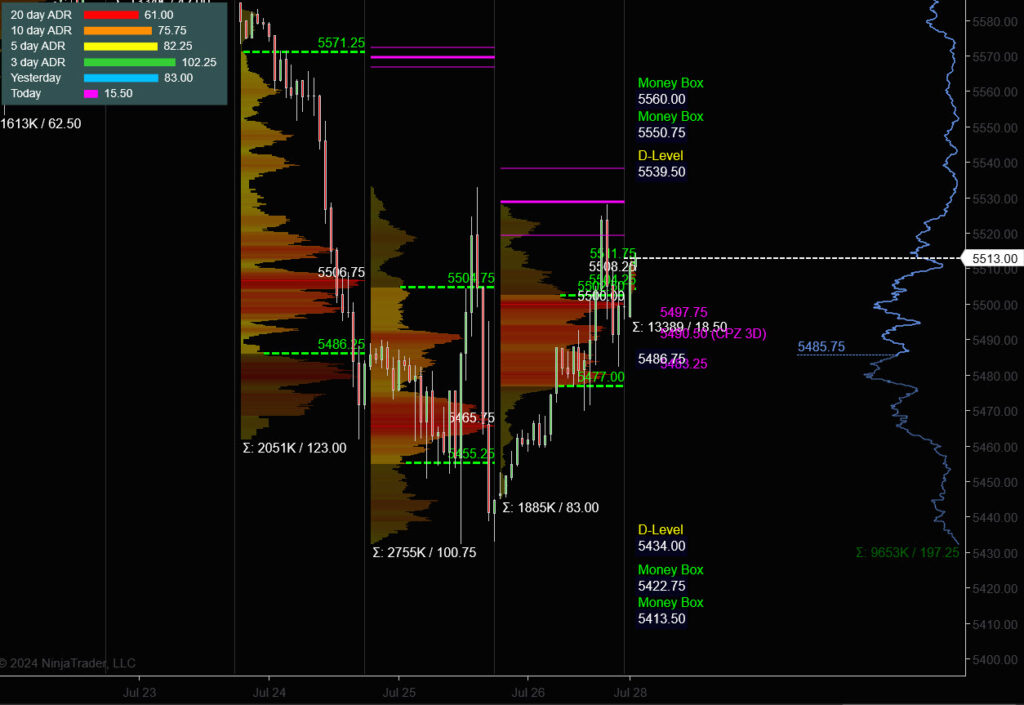
Prior Session was Cycle Day 1: Price established a new cycle low early in the session at 5470 and proceeded to rally to 5524 3 Day Central Pivot Zone. Afternoon reversal which began @ 1:30 pm pushed price back to Initial Balance Midpoint (5485), then consolidated the remainder of the day, settling at 5499.25. Range was 83 handles on 1.885M contracts exchanged.
…Transition from Cycle Day 1 to Cycle Day 2
This leads us into Cycle Day 2: Price is in the midst of a multi-day composite balancing zone between 5460 – 5515 value area. Expectation will be for continued elevated volatility consolidation-type trade within value, as a heavy economic calendar, corporate earnings drop, and FOMC Presser on Wednesday will fill this week with plenty of trade opportunities.
Know Thy Plan! Our discipline of maintaining positioning that is aligned with market forces continues to serve us well, so stay the course.
As such, scenarios to consider for today’s trading.
Bull Scenario: Price sustains a bid above 5515, initially targets 5525 – 5530 zone.
Bear Scenario: Price sustains an offer below 5490, initially targets 5475 – 5470 zone.
PVA High Edge = 5512 PVA Low Edge = 5477 Prior POC = 5500
PTG 3 Day Cycle
EXCLUSIVE OFFER

*****The 3 Day Cycle has a 91.67% probability of fulfilling Positive Cycle Statistics covering 12 years of recorded tracking history.
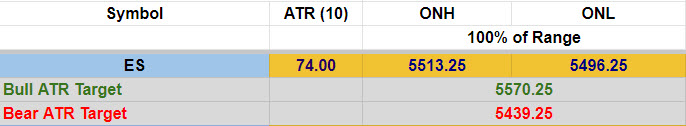
Link to: Dynamic Range Projections (ES) Sept (U) 2024
ES Chart
Nasdaq 100 (NQ)

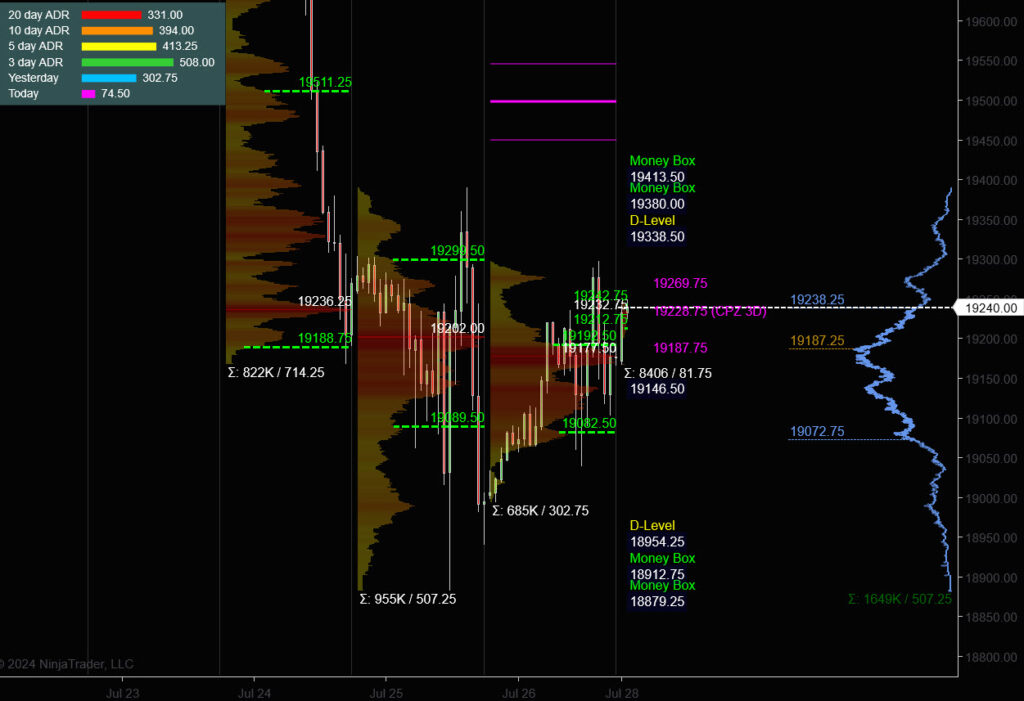
Prior Session was Cycle Day 1: Price established a new cycle low early in the session at 19040 and proceeded to rally to 19265 range target. Afternoon reversal which began @ 1:30 pm pushed price back to Initial Balance Midpoint (19118.75), then consolidated the remainder of the day, settling at 19175. Range was 302 handles on 685k contracts exchanged.
…Transition from Cycle Day 1 to Cycle Day 2
This leads us into Cycle Day 2: Price is in the midst of a multi-day composite balancing zone between 19050 – 19335 value area. Expectation will be for continued elevated volatility consolidation-type trade within value, as a heavy economic calendar, corporate earnings drop, and FOMC Presser on Wednesday will fill this week with plenty of trade opportunities. So stay nimble!
Know Thy Plan! Our discipline of maintaining positioning that is aligned with market forces continues to serve us well, so stay the course.
As such, scenarios to consider for today’s trading.
Bull Scenario: Price sustains a bid above 19180, initially targets 19280 – 19335 zone.
Bear Scenario: Price sustains an offer below 19180, initially targets 19110 – 19050 zone.
PVA High Edge = 19192 PVA Low Edge = 19082 Prior POC = 19177
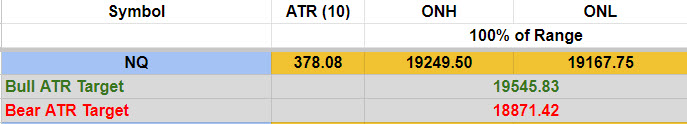
Link to: Dynamic Range Projections (NQ) Sept (U) 2024
NQ Chart
Trade Strategy: Our tactical trade strategy will simply remain unaltered…We’ll be flexible to trade both long and short side from Decision Pivot Levels. Continue to focus on Bull/Bear Stackers and Premium/Discounts. As always, remaining in alignment with dominant intra-day force increases probabilities of producing winning trades.
Stay Focused…Non-Biased…Disciplined ALWAYS USE STOPS!
Good Trading…David
“Knowing is not enough, We must APPLY. Willing is not enough, We must DO.” –BR
*****This trade strategy report is disseminated for “education only” and should not be viewed in any way as a recommendation to buy or sell futures products.”
PAST PERFORMANCE IS NOT NECESSARILY INDICATIVE OF FUTURE RESULTS
IMPORTANT NOTICE! No representation is being made that the use of this strategy or any system or trading methodology will generate profits. Past performance is not necessarily indicative of future results. There is substantial risk of loss associated with trading securities and options on equities. Only risk capital should be used to trade. Trading securities is not suitable for everyone.
Disclaimer: Futures, Options, and Currency trading all have large potential rewards, but they also have large potential risk. You must be aware of the risks and be willing to accept them in order to invest in these markets. Don’t trade with money you can’t afford to lose.
This website is neither a solicitation nor an offer to Buy/Sell futures, options, or currencies. No representation is being made that any account will or is likely to achieve profits or losses similar to those discussed on this web site. The past performance of any trading system or methodology is not necessarily indicative of future results.
CFTC RULE 4.41 –HYPOTHETICAL OR SIMULATED PERFORMANCE RESULTS HAVE CERTAIN LIMITATIONS. UNLIKE AN ACTUAL PERFORMANCE RECORD, SIMULATED RESULTS DO NOT REPRESENT ACTUAL TRADING. ALSO, SINCE THE TRADES HAVE NOT BEEN EXECUTED, THE RESULTS MAY HAVE UNDER-OR-OVER COMPENSATED FOR THE IMPACT, IF ANY, OF CERTAIN MARKET FACTORS, SUCH AS LACK OF LIQUIDITY. SIMULATED TRADING PROGRAMS IN GENERAL ARE ALSO SUBJECT TO THE FACT THAT THEY ARE DESIGNED WITH THE BENEFIT OF HINDSIGHT. NO REPRESENTATION IS BEING MADE THAT ANY ACCOUNT WILL OR IS LIKELY TO ACHIEVE PROFIT OR LOSSES SIMILAR TO THOSE SHOWN