
Markets

Source: Yahoo Finance
Economic Calendar
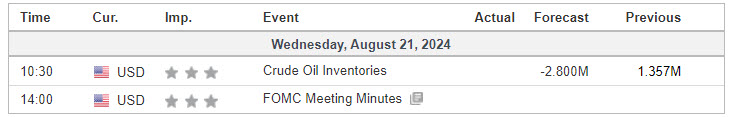
Source: Investing.com
S&P 500

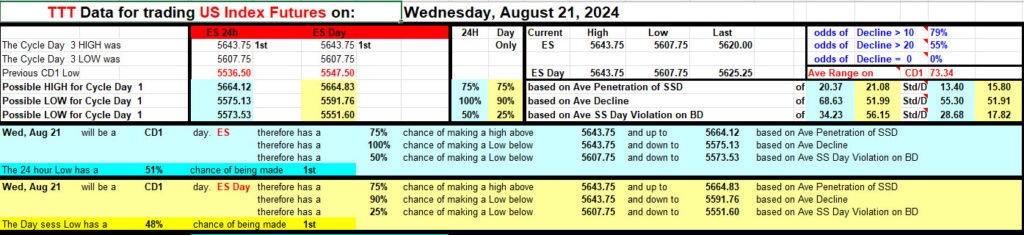
Prior Session was Cycle Day 3: Positive 3 Day Cycle as price fulfilled all upside targets but failed to extend the rally, pulled back and consolidated around the 5620 Line in the Sand (LIS) as outlined in prior DTS Briefing 8.20.24. Range was 36 handles on 973k contracts exchanged.
…Transition from Cycle Day 3 to Cycle Day 1
This leads us into Cycle Day 1: This session begins a new cycle with the primary objective to find a secure low from which to stage the next rally. Partial decline is in-place at the 5608 level. Should further weakness develop, lower levels to note are 5595- 5590 zone, followed by 5575 – 5565 key pivot support. Bulls would need to reclaim 5630 or higher in order to retest 5643 recent high.
Our discipline of maintaining positioning that is aligned with market forces continues to serve us well, so stay the course.
As such, scenarios to consider for today’s trading.
Bull Scenario: Price sustains a bid above 5610, initially targets 5625 – 5630 zone.
Bear Scenario: Price sustains an offer below 5610, initially targets 5595 – 5590 zone.
PVA High Edge = 5630 PVA Low Edge = 5615 Prior POC = 5620
PTG 3 Day Cycle
EXCLUSIVE OFFER

*****The 3 Day Cycle has a 90.91% probability of fulfilling Positive Cycle Statistics covering 12 years of recorded tracking history.
ES Chart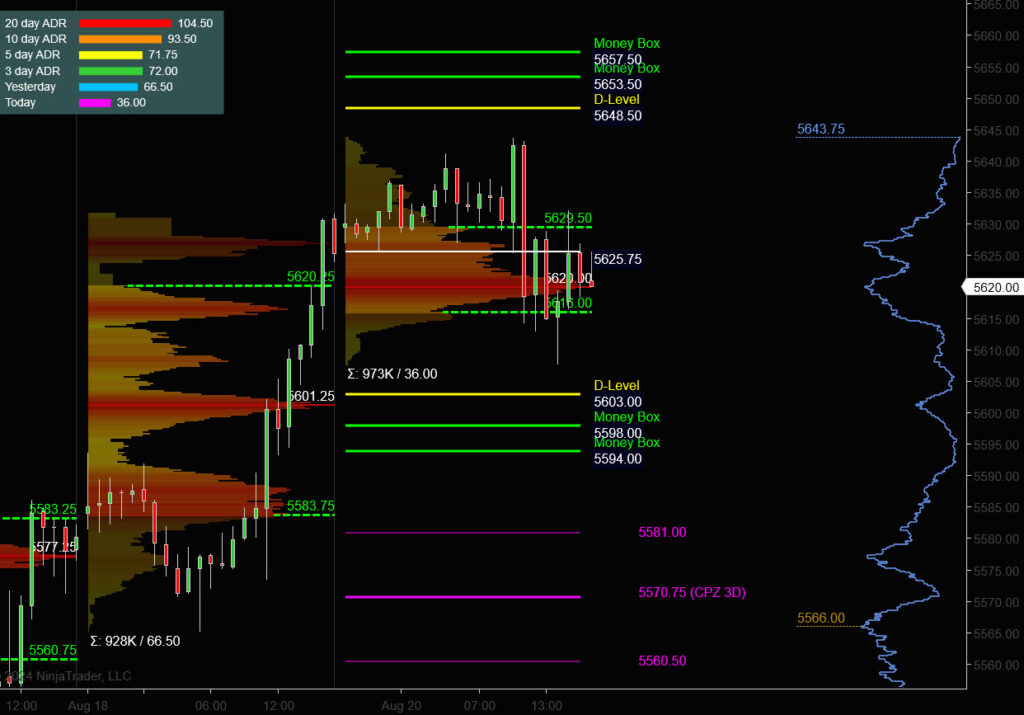
Nasdaq 100 (NQ)

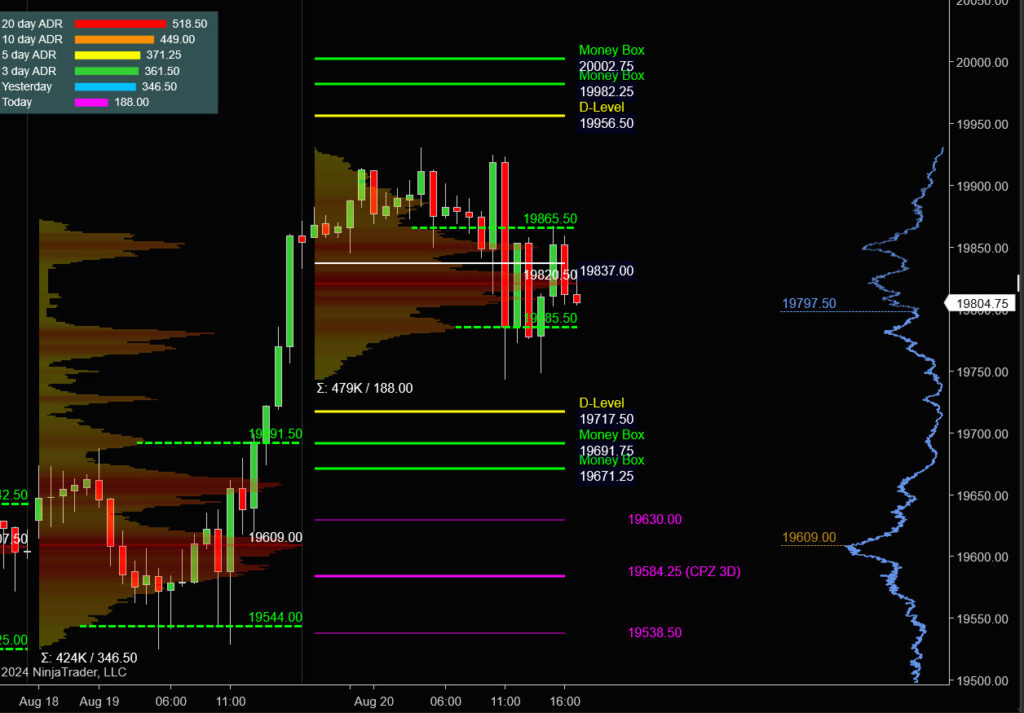
Prior Session was Cycle Day 3: Positive 3 Day Cycle as price fulfilled all upside targets but failed to extend the rally, pulled back and consolidated recent gains within 19785 – 19865 Value Zone. Range was 188 handles on 479k contracts exchanged.
…Transition from Cycle Day 3 to Cycle Day 1
This leads us into Cycle Day 1: This session begins a new cycle with the primary objective to find a secure low from which to stage the next rally. Partial decline is in-place at the 19811 level. Should further weakness develop, lower levels to note are 19750…19717…19692…19671. Bulls would need to reclaim 19865 or higher in order to retest 19931 recent high.
Our discipline of maintaining positioning that is aligned with market forces continues to serve us well, so stay the course.
As such, scenarios to consider for today’s trading.
Bull Scenario: Price sustains a bid above 19785, initially targets 19850 – 19865 zone.
Bear Scenario: Price sustains an offer below 19785, initially targets 19717 – 19692 zone.
PVA High Edge = 19865 PVA Low Edge = 19785 Prior POC = 19802
NQ Chart
Trade Strategy: Our tactical trade strategy will simply remain unaltered…We’ll be flexible to trade both long and short side from Decision Pivot Levels. Continue to focus on Bull/Bear Stackers and Premium/Discounts. As always, remaining in alignment with dominant intra-day force increases probabilities of producing winning trades.
Stay Focused…Non-Biased…Disciplined ALWAYS USE STOPS!
Good Trading…David
“Knowing is not enough, We must APPLY. Willing is not enough, We must DO.” –BR
*****This trade strategy report is disseminated for “education only” and should not be viewed in any way as a recommendation to buy or sell futures products.”
PAST PERFORMANCE IS NOT NECESSARILY INDICATIVE OF FUTURE RESULTS
IMPORTANT NOTICE! No representation is being made that the use of this strategy or any system or trading methodology will generate profits. Past performance is not necessarily indicative of future results. There is substantial risk of loss associated with trading securities and options on equities. Only risk capital should be used to trade. Trading securities is not suitable for everyone.
Disclaimer: Futures, Options, and Currency trading all have large potential rewards, but they also have large potential risk. You must be aware of the risks and be willing to accept them in order to invest in these markets. Don’t trade with money you can’t afford to lose.
This website is neither a solicitation nor an offer to Buy/Sell futures, options, or currencies. No representation is being made that any account will or is likely to achieve profits or losses similar to those discussed on this web site. The past performance of any trading system or methodology is not necessarily indicative of future results.
CFTC RULE 4.41 –HYPOTHETICAL OR SIMULATED PERFORMANCE RESULTS HAVE CERTAIN LIMITATIONS. UNLIKE AN ACTUAL PERFORMANCE RECORD, SIMULATED RESULTS DO NOT REPRESENT ACTUAL TRADING. ALSO, SINCE THE TRADES HAVE NOT BEEN EXECUTED, THE RESULTS MAY HAVE UNDER-OR-OVER COMPENSATED FOR THE IMPACT, IF ANY, OF CERTAIN MARKET FACTORS, SUCH AS LACK OF LIQUIDITY. SIMULATED TRADING PROGRAMS IN GENERAL ARE ALSO SUBJECT TO THE FACT THAT THEY ARE DESIGNED WITH THE BENEFIT OF HINDSIGHT. NO REPRESENTATION IS BEING MADE THAT ANY ACCOUNT WILL OR IS LIKELY TO ACHIEVE PROFIT OR LOSSES SIMILAR TO THOSE SHOWN