
S&P 500

Important Note: We have begun publishing the PTG Trading Room Daily RECAP which you should be receiving at the end of each trading day. This publication is a more detailed review of how the trading unfolded throughout the day from our viewpoint. It is an “educational” complimentary companion to be used in conjunction with the Daily Trade Strategy. It continues to be “work-in-progress”, so please offer feedback as to content, style and relevance. We are always striving to make PTG Products and Services the very best
Prior Session was Cycle Day 3: Positive 3-Day Cycle as this session reflected a steady consolidation within the 5780 to 5750 range outlined in the prior Daily Trade Strategy Briefing 9.23.24, following the third day post-FOMC rate cut.
The pre-RTH and early RTH hours saw price activity oscillating within the defined range, with a focus on buy-side dips near the Value Area Low (VAL). Despite some attempts, bulls struggled to clear and convert the 5780-5785 zone into solid support for a higher push.
The afternoon session continued in a coiling or contraction phase, as outlined earlier, with price stabilizing around the 5772 POC. The day’s lack of volatility and directional bias indicates a balanced demand-supply environment, suggesting that an expansion phase could soon follow once the range breaks decisively. The small buy imbalance into the close may signal some bullish leanings but remains within the context of consolidation. Range was 39 handles on 1.013M contracts exchanged.
Key takeaways include:
- Range-bound action between 5750-5780
- Bulls need to clear the 5785 level to initiate a stronger upward move
- Contraction phase likely to give way to expansion, possibly in the next session.
…Transition from Cycle Day 3 to Cycle Day 1
This leads us into Cycle Day 1: New cycle begins with the Average Decline initially measuring 5749. Price is currently in a 3-day balancing as the market digests the future implications of the FED’s 50 bps rate cut.
Typically markets ebb n flow from Contractionary to Expansionary periods. The next expansionary phase will develop, so we need to be prepared for when it does. I have noted some level ideas for the next expansion, which is meant to be an overview guide.
Expansion Trigger Level?
The key level to watch for an expansion trigger would be 5785 on the upside. This was noted as a resistance zone that bulls have struggled to clear.
If price action breaks above 5785 and holds, it could act as a trigger for expansion and a potential rally to higher levels, with upside targets around 5800-5820 or higher, depending on momentum.
On the downside, if price breaks below 5740, which was the lower boundary of the overnight/pre-RTH range, it could trigger a downward expansion, with potential targets around 5720-5700.
So, the critical trigger levels for expansion:
- Upside: Break and hold above 5785.
- Downside: Break below 5740.
Our discipline of maintaining positioning that is aligned with market forces continues to serve us well, so stay the course.
As such, scenarios to consider for today’s trading.
Bull Scenario: Price sustains a bid above 5770, initially targets 5785 – 5800 zone.
Bear Scenario: Price sustains an offer below 5770, initially targets 5745 – 5740 zone.
PVA High Edge = 5779 PVA Low Edge = 5769 Prior POC = 5772
ES Chart (Profile)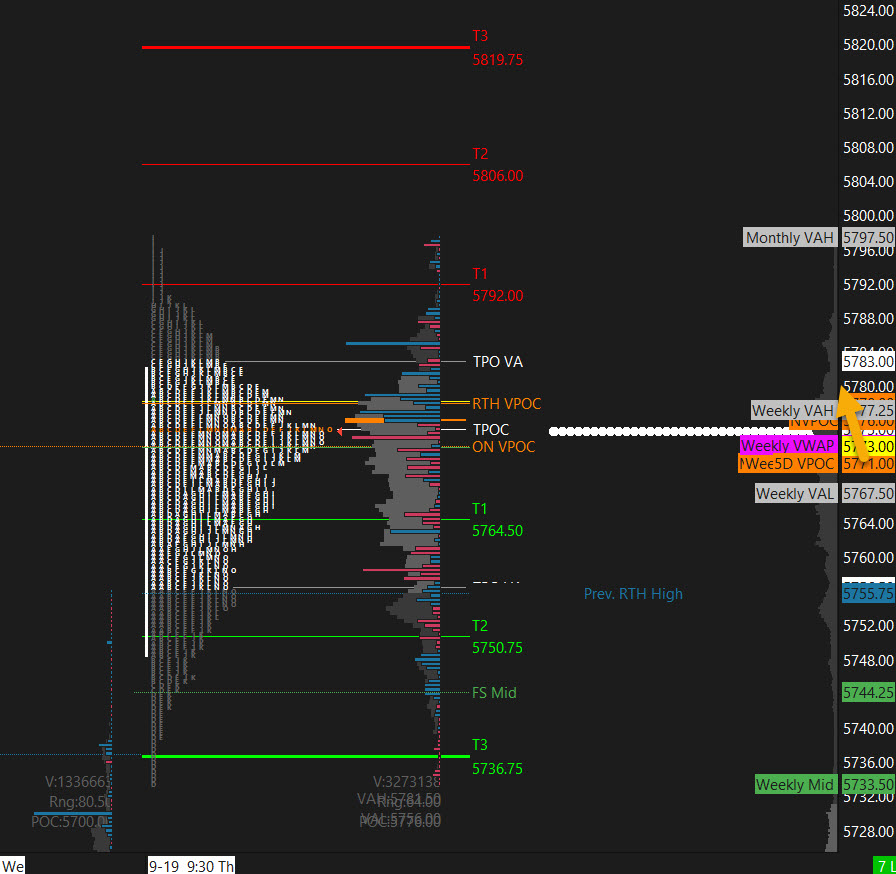
Nasdaq 100 (NQ)

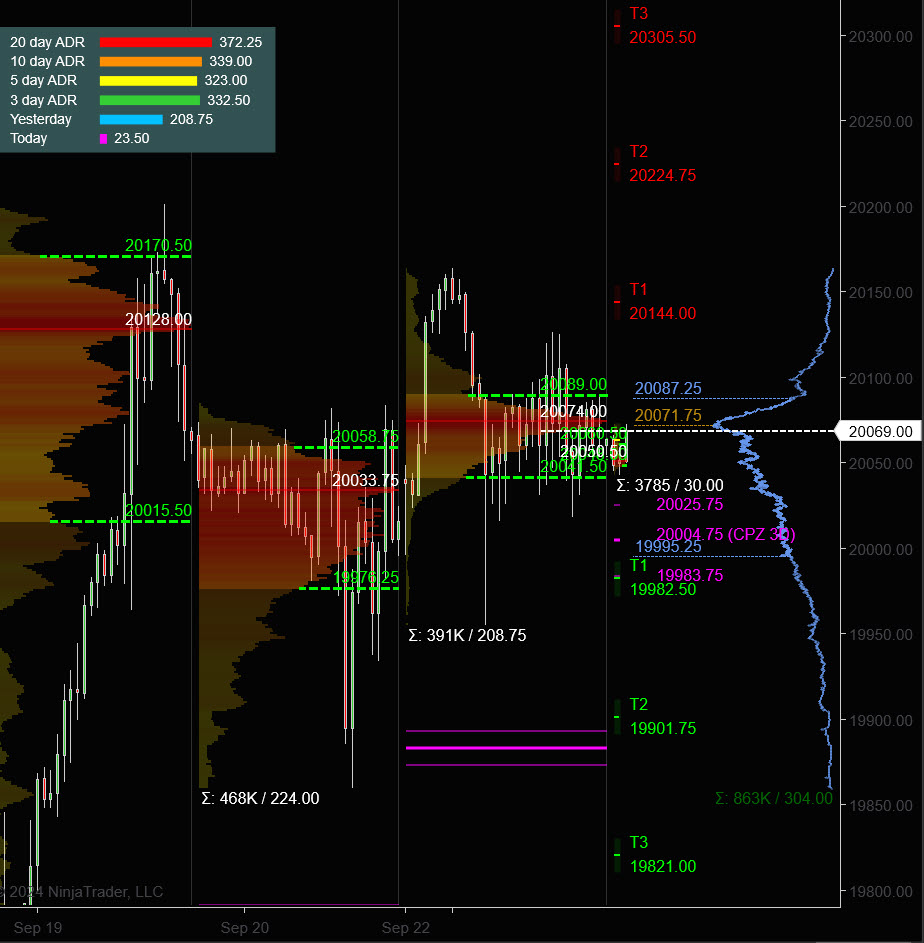
Prior Session was Cycle Day 3: Positive 3-Day Cycle as this session reflected a steady consolidation within the 20016 to 20128 range for 3rd consecutive balancing day. Range was 208 handles on 391k contracts exchanged.
…Transition from Cycle Day 3 to Cycle Day 1
This leads us into Cycle Day 1: New cycle begins with the Average Decline initially measuring 20043. Price is currently in a 3-day balancing as the market digests the future implications of the FED’s 50 bps rate cut. We’ll be “On-Watch” for the next directional expansionary phase either above 20165 or below 19955 range edges.
Our discipline of maintaining positioning that is aligned with market forces continues to serve us well, so stay the course.
As such, scenarios to consider for today’s trading.
Bull Scenario: Price sustains a bid above 20070, initially targets 20145 – 20165 zone.
Bear Scenario: Price sustains an offer below 20070, initially targets 19980 – 19955 zone.
PVA High Edge = 20089 PVA Low Edge = 20041 Prior POC = 20074
NQ Chart (Profile)
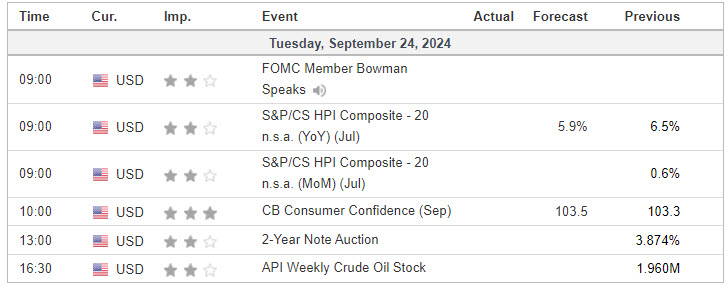
Economic Calendar
Trade Strategy: Our tactical trade strategy will simply remain unaltered…We’ll be flexible to trade both long and short side from Decision Pivot Levels. Continue to focus on Bull/Bear Stackers and Premium/Discounts. As always, remaining in alignment with dominant intra-day force increases probabilities of producing winning trades.
Stay Focused…Non-Biased…Disciplined ALWAYS USE STOPS!
Good Trading…David
“Knowing is not enough, We must APPLY. Willing is not enough, We must DO.” –BR
*****This trade strategy report is disseminated for “education only” and should not be viewed in any way as a recommendation to buy or sell futures products.”
PAST PERFORMANCE IS NOT NECESSARILY INDICATIVE OF FUTURE RESULTS
IMPORTANT NOTICE! No representation is being made that the use of this strategy or any system or trading methodology will generate profits. Past performance is not necessarily indicative of future results. There is substantial risk of loss associated with trading securities and options on equities. Only risk capital should be used to trade. Trading securities is not suitable for everyone.
Disclaimer: Futures, Options, and Currency trading all have large potential rewards, but they also have large potential risk. You must be aware of the risks and be willing to accept them in order to invest in these markets. Don’t trade with money you can’t afford to lose.
This website is neither a solicitation nor an offer to Buy/Sell futures, options, or currencies. No representation is being made that any account will or is likely to achieve profits or losses similar to those discussed on this web site. The past performance of any trading system or methodology is not necessarily indicative of future results.
CFTC RULE 4.41 –HYPOTHETICAL OR SIMULATED PERFORMANCE RESULTS HAVE CERTAIN LIMITATIONS. UNLIKE AN ACTUAL PERFORMANCE RECORD, SIMULATED RESULTS DO NOT REPRESENT ACTUAL TRADING. ALSO, SINCE THE TRADES HAVE NOT BEEN EXECUTED, THE RESULTS MAY HAVE UNDER-OR-OVER COMPENSATED FOR THE IMPACT, IF ANY, OF CERTAIN MARKET FACTORS, SUCH AS LACK OF LIQUIDITY. SIMULATED TRADING PROGRAMS IN GENERAL ARE ALSO SUBJECT TO THE FACT THAT THEY ARE DESIGNED WITH THE BENEFIT OF HINDSIGHT. NO REPRESENTATION IS BEING MADE THAT ANY ACCOUNT WILL OR IS LIKELY TO ACHIEVE PROFIT OR LOSSES SIMILAR TO THOSE SHOWN