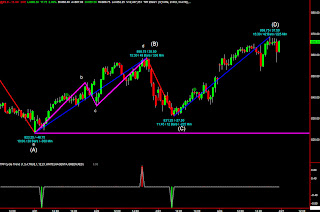
The above chart shows the PTG Cycle Trend buy and sell signals on the 15 min chart of the ES. Support is at 823.25 pivot. The current structure is a symmetrical AB=CD pattern. You can also see the Wave AB is defined by a smaller degree symmetrical ab=cd pattern. The symmetry has been near perfect with cycle buys and sells firing at the pivots.
