
Markets

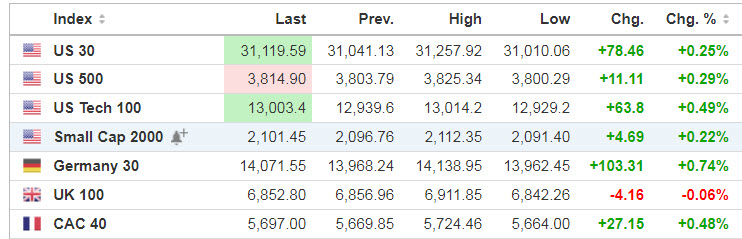
Source: SeekingAlpha.com
Economic Calendar

Forecasts: Consensus estimates see 75,000 jobs added last month, less than a third of November’s gains, as the coronavirus spread rapidly across the U.S. A number of Wall Street firms even see negative job growth, with predictions from Goldman Sachs, JPMorgan, Credit Suisse and Barclays ranging from a loss of 25,000 to 50,000 positions.
8:30 Non-farm payrolls
10:00 Wholesale Inventories (Preliminary)
11:00 Fed’s Clarida Speech
1:00 PM Baker-Hughes Rig Count
3:00 PM Consumer Credit
https://www.investing.com/economic-calendar/
***New: PTG Trading Room Chat Log’s Link
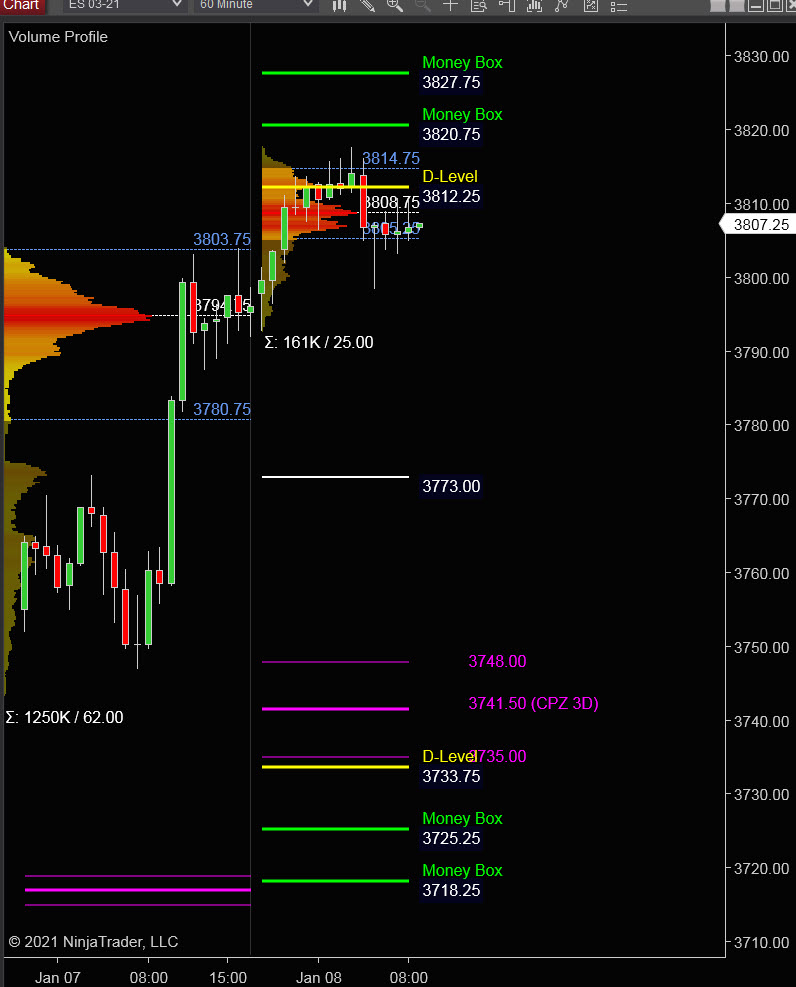
S&P 500

Monday’s Session was Cycle Day 1 (CD1): Shallow price decline is the hallmark of underlying strength, as cycle rally propelled ever higher to fulfill 3 Day Cycle Objectives. Range was 62 handles on 1.250M contracts exchanged.
…Transition from Cycle Day 1 to Cycle Day 2
This leads us into Cycle Day 2 (CD2): Price is currently holding above prior Value High (3804) during overnight trade. Bulls will need to keep the auction buoyed above this level for further upside potential. There are two estimated scenarios to consider for today’s trading.
1.) Price sustains a bid above 3804, initially targets 3814 – 3818 zone.
2.) Price sustains an offer below 3804, initially targets 3794 – 3790 zone.
*****3 Day Cycle has a 91% probability of fulfilling Positive Statistic covering 12 years of recorded tracking history.
PVA High Edge = 3804 PVA Low Edge = 3780 Prior POC = 3794
Range Projections and Key Levels (ES) March 2021 (H) Contract
HOD ATR Range Projection: 3838; LOD ATR Range Projection: 3772; 3 Day Central Pivot: 3742; 3 Day Cycle Target: 3807; 10 Day Average True Range 45; VIX: 22
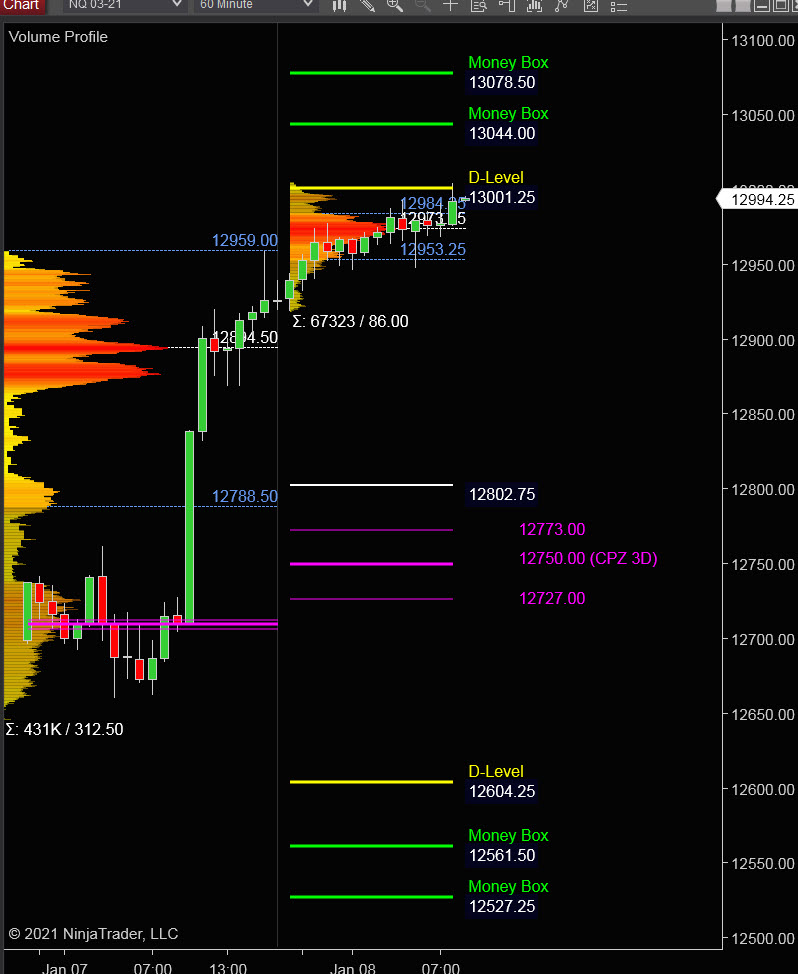
Nasdaq 100 (NQ)

Today is Cycle Day 2 (CD2)…Price is extending gains above prior Value High in pre-RTH activity. Prior range was 312.50 handles on 431k contracts exchanged. As such, there are two estimated scenarios to consider for today’s trading.
PVA High Edge = 12960 PVA Low Edge = 12788 Prior POC = 12894
Bull Scenario: IF Bulls sustain a bid above 12960, THEN initial upside estimate targets 13000 – 13044 zone.
Bear Scenario: IF Bears sustain an offer below 12960, THEN initial downside estimate targets 12920 – 12895 zone.
Range Projections and Key Levels (NQ) March 2021 (H) Contract
HOD ATR Range Projection: 13095; LOD ATR Range Projection: 12828; 3 Day Central Pivot: 12750; 3 Day Cycle Target: 12917; 10 Day Average True Range: 177; VIX: 22
Trade Strategy: Our tactical trade strategy will simply remain unaltered…We’ll be flexible to trade both long and short side from Decision Pivot Levels. Continue to focus on Bull/Bear Stackers and Premium/Discounts. As always, remaining in alignment with dominant intra-day force increases probabilities of producing winning trades.
Stay Focused…Non-Biased…Disciplined ALWAYS USE STOPS!
Good Trading…David
“Knowing is not enough, We must APPLY. Willing is not enough, We must DO.” –Bruce Lee
*****This trade strategy report is disseminated for “education only” and should not be viewed in any way as a recommendation to buy or sell futures products.”
PAST PERFORMANCE IS NOT NECESSARILY INDICATIVE OF FUTURE RESULTS
IMPORTANT NOTICE! No representation is being made that the use of this strategy or any system or trading methodology will generate profits. Past performance is not necessarily indicative of future results. There is substantial risk of loss associated with trading securities and options on equities. Only risk capital should be used to trade. Trading securities is not suitable for everyone.
Disclaimer: Futures, Options, and Currency trading all have large potential rewards, but they also have large potential risk. You must be aware of the risks and be willing to accept them in order to invest in these markets. Don’t trade with money you can’t afford to lose.
This website is neither a solicitation nor an offer to Buy/Sell futures, options, or currencies. No representation is being made that any account will or is likely to achieve profits or losses similar to those discussed on this web site. The past performance of any trading system or methodology is not necessarily indicative of future results.
CFTC RULE 4.41 –HYPOTHETICAL OR SIMULATED PERFORMANCE RESULTS HAVE CERTAIN LIMITATIONS. UNLIKE AN ACTUAL PERFORMANCE RECORD, SIMULATED RESULTS DO NOT REPRESENT ACTUAL TRADING. ALSO, SINCE THE TRADES HAVE NOT BEEN EXECUTED, THE RESULTS MAY HAVE UNDER-OR-OVER COMPENSATED FOR THE IMPACT, IF ANY, OF CERTAIN MARKET FACTORS, SUCH AS LACK OF LIQUIDITY. SIMULATED TRADING PROGRAMS IN GENERAL ARE ALSO SUBJECT TO THE FACT THAT THEY ARE DESIGNED WITH THE BENEFIT OF HINDSIGHT. NO REPRESENTATION IS BEING MADE THAT ANY ACCOUNT WILL OR IS LIKELY TO ACHIEVE PROFIT OR LOSSES SIMILAR TO THOSE SHOWN