
Markets

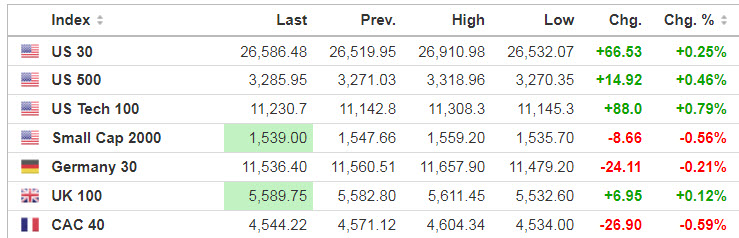
Futures are trading near lows pre-RTH following a session that saw the biggest plunge for stocks since June on a resurgence in the number of deaths and hospitalizations due to COVID-19: Dow +0.8%; S&P +1%; Nasdaq +1.3%.
Source: SeekingAlpha.com
Economic Calendar

U.S. GDP data due out at 8:30 a.m. ET will be one for the record books, with forecasts of annualized growth of 31% in Q3, but it also follows an annualized decline of 31.4% in Q2, which marked the sharpest pullback in modern American history.
8:30 Initial Jobless Claims
8:30 GDP Q3
10:00 Pending Home Sales
10:30 EIA Natural Gas Inventory
https://www.investing.com/economic-calendar/
***New: PTG Trading Room Chat Log’s Link
S&P 500

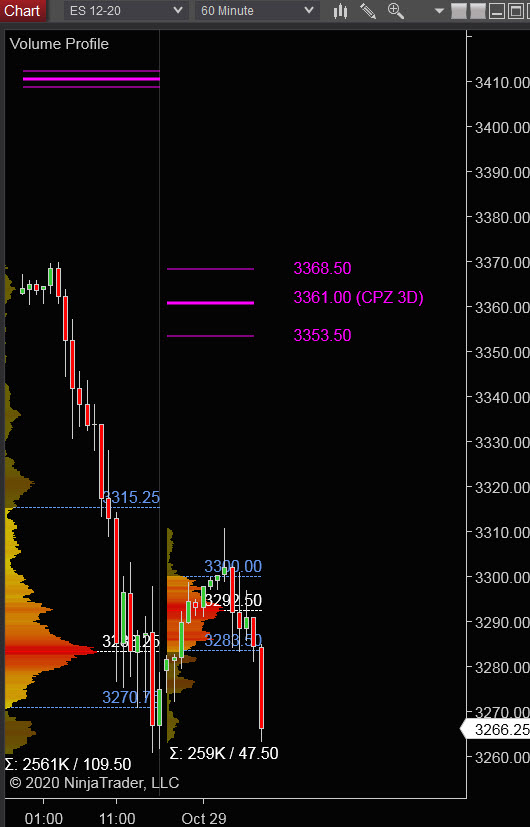
Prior Session was Cycle Day 3 (CD3): Price continued it’s sell down closing near lows of the session. 3 Day Cycle Statistic was fulfilled on 24 hr basis but failed to achieve in the RTH. Range was 109.50 handles (twice the average) on 2.561M contracts exchanged.
…Transition from Cycle Day 3 to Cycle Day 1
This leads us into Cycle Day 1 (CD1): Price is currently trading near prior low ( 3260.75) in pre-RTH trade, as the CD1 Average Decline (3278) has been fulfilled. As such, there are two scenarios to consider for today’s trading.
1.) Price sustains a bid above 3270, initially targets 3285 – 3295 zone.
2.) Price sustains an offer below 3270, initially targets 3260 – 3250 zone with CD1 Violation Zone measuring 3229 – 3222.
*****3 Day Cycle has a 91% probability of fulfilling Positive Statistic covering 12 years of recorded tracking history.
PVA High Edge = 3316 PVA Low Edge = 3270 Prior POC = 3283
Range Projections and Key Levels (ES) December 2020 (Z) Contract
HOD ATR Range Projection: 3321; LOD ATR Range Projection: 3254; 3 Day Central Pivot: 3361; 3 Day Cycle Target: 3296; 10 Day Average True Range 57; VIX: 40
Nasdaq 100 (NQ)

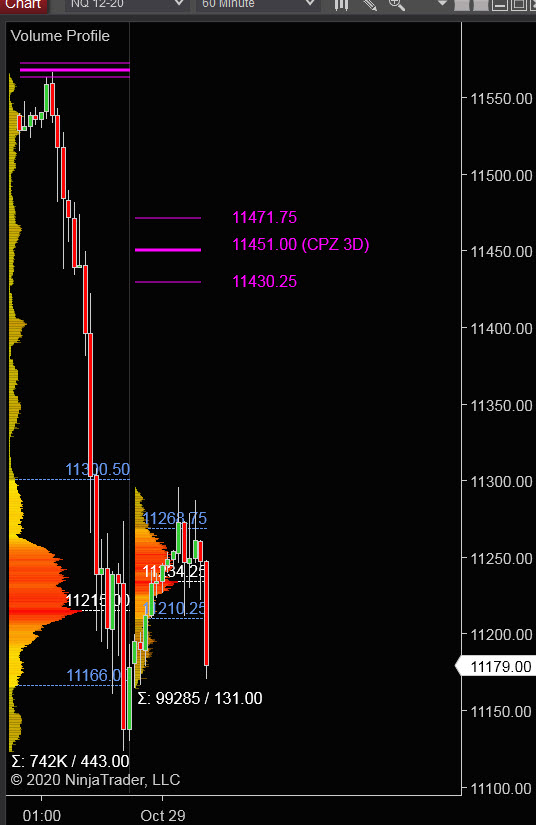
Today is Cycle Day 1 (CD1)…Normal for CD1 is decline with average measuring 11215 handle. For today’s trading, there are two scenarios to consider.
PVA High Edge = 11300 PVA Low Edge = 11166 Prior POC = 11215
Bull Scenario: IF Bulls sustain a bid above 11215, THEN initial upside estimate targets 11255 – 11280 zone.
Bear Scenario: IF Bears sustain an offer below 11215, THEN initial downside estimate targets 11165 – 11124 zone.
Range Projections and Key Levels (NQ) December 2020 (Z) Contract
HOD ATR Range Projection: 11405; LOD ATR Range Projection: 11052; 3 Day Central Pivot: 11451; 3 Day Cycle Target: 11255; 10 Day Average True Range: 244; VIX: 40
Trade Strategy: Our tactical trade strategy will simply remain unaltered…We’ll be flexible to trade both long and short side from Decision Pivot Levels. Continue to focus on Bull/Bear Stackers and Premium/Discounts. As always, remaining in alignment with dominant intra-day force increases probabilities of producing winning trades.
Stay Focused…Non-Biased…Disciplined ALWAYS USE STOPS!
Good Trading…David
“Knowing is not enough, We must APPLY. Willing is not enough, We must DO.” –Bruce Lee
*****This trade strategy report is disseminated for “education only” and should not be viewed in any way as a recommendation to buy or sell futures products.”
PAST PERFORMANCE IS NOT NECESSARILY INDICATIVE OF FUTURE RESULTS
IMPORTANT NOTICE! No representation is being made that the use of this strategy or any system or trading methodology will generate profits. Past performance is not necessarily indicative of future results. There is substantial risk of loss associated with trading securities and options on equities. Only risk capital should be used to trade. Trading securities is not suitable for everyone.
Disclaimer: Futures, Options, and Currency trading all have large potential rewards, but they also have large potential risk. You must be aware of the risks and be willing to accept them in order to invest in these markets. Don’t trade with money you can’t afford to lose.
This website is neither a solicitation nor an offer to Buy/Sell futures, options, or currencies. No representation is being made that any account will or is likely to achieve profits or losses similar to those discussed on this web site. The past performance of any trading system or methodology is not necessarily indicative of future results.
CFTC RULE 4.41 –HYPOTHETICAL OR SIMULATED PERFORMANCE RESULTS HAVE CERTAIN LIMITATIONS. UNLIKE AN ACTUAL PERFORMANCE RECORD, SIMULATED RESULTS DO NOT REPRESENT ACTUAL TRADING. ALSO, SINCE THE TRADES HAVE NOT BEEN EXECUTED, THE RESULTS MAY HAVE UNDER-OR-OVER COMPENSATED FOR THE IMPACT, IF ANY, OF CERTAIN MARKET FACTORS, SUCH AS LACK OF LIQUIDITY. SIMULATED TRADING PROGRAMS IN GENERAL ARE ALSO SUBJECT TO THE FACT THAT THEY ARE DESIGNED WITH THE BENEFIT OF HINDSIGHT. NO REPRESENTATION IS BEING MADE THAT ANY ACCOUNT WILL OR IS LIKELY TO ACHIEVE PROFIT OR LOSSES SIMILAR TO THOSE SHOWN