
Markets

Dow and S&P 500 futures are ahead by 1.6%, contracts tied to the Nasdaq are up 2%, while equities jumped across the globe.
In Asia, Japan +2.1%. Hong Kong +1.2%. China +1.9%. India +1.7%.
In Europe, at midday, London +1.4%. Paris +1.6%. Frankfurt +1.9%.
Futures at 6:20, Dow +1.6%. S&P +1.6%. Nasdaq +2%. Crude +2.5% to $38.07. Gold +0.4% at $1959.20. Bitcoin +2.2% to $15495.
Ten-year Treasury Yield flat at 0.81%
Source: SeekingAlpha.com
Economic Calendar
12:30 PM Investor Movement Index
1:00 PM Results of $54B, 3-Year Note Auction
1:30 PM Fed’s Mester Speech
2:20 PM Fed’s Harker Speech
https://www.investing.com/economic-calendar/
***New: PTG Trading Room Chat Log’s Link
S&P 500

Prior Session was Cycle Day 1 (CD1): Price put in an early CD1 Low securing the subsequent initial cycle rally, closing firm for week’s end. Range was 62.25 handles on 1.506M contracts exchanged.
…Transition from Cycle Day 1 to Cycle Day 2
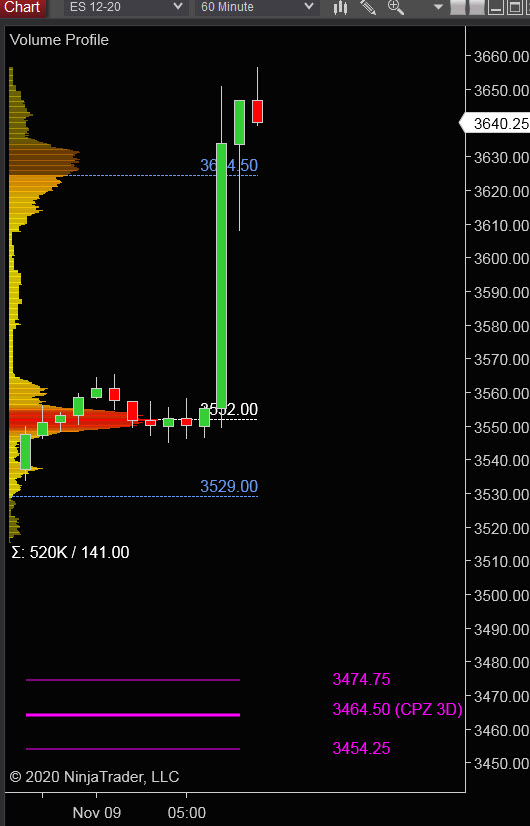
This leads us into Cycle Day 2 (CD2): Bullish price gap on Globex Open has “jumped the creek” above prior week’s high pushing 135 handles to 3650 and new all time high. As such, there are two estimated scenarios to consider for today’s trading.
1.) Price sustains a bid above 3625, initially targets 3645 – 3650 zone.
2.) Price sustains an offer below 3625, initially targets 3340 – 3330 zone.
*****3 Day Cycle has a 91% probability of fulfilling Positive Statistic covering 12 years of recorded tracking history.
PVA High Edge = 3508 PVA Low Edge = 3490 Prior POC = 3500
Range Projections and Key Levels (ES) December 2020 (Z) Contract
HOD ATR Range Projection: 3595; LOD ATR Range Projection: 3572; 3 Day Central Pivot: 3465; 3 Day Cycle Target: 3528; 10 Day Average True Range 79; VIX: 23
Nasdaq 100 (NQ)

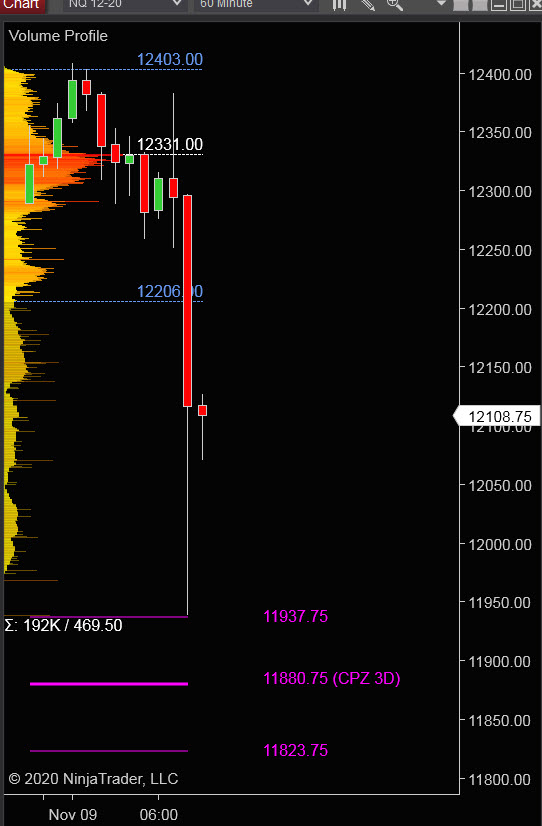
Today is Cycle Day 2 (CD2)…Price vaulted during Globex Session fulfilling CD2 Statistical Deviation Target (12368). Currently price is trading well off highs in extreme volatile action, relinquishing most of gains. As such, there are two scenarios to consider.
PVA High Edge = 12098 PVA Low Edge = 11982 Prior POC = 12059
Bull Scenario: IF Bulls sustain a bid above 12100, THEN initial upside estimate targets 12225 – 12285 zone.
Bear Scenario: IF Bears sustain an offer below 12100, THEN initial downside estimate targets 12050 – 12025 zone.
Range Projections and Key Levels (NQ) December 2020 (Z) Contract
HOD ATR Range Projection: 12275; LOD ATR Range Projection: 12072; 3 Day Central Pivot: 11880; 3 Day Cycle Target: 12188; 10 Day Average True Range: 336; VIX: 23
Trade Strategy: Our tactical trade strategy will simply remain unaltered…We’ll be flexible to trade both long and short side from Decision Pivot Levels. Continue to focus on Bull/Bear Stackers and Premium/Discounts. As always, remaining in alignment with dominant intra-day force increases probabilities of producing winning trades.
Stay Focused…Non-Biased…Disciplined ALWAYS USE STOPS!
Good Trading…David
“Knowing is not enough, We must APPLY. Willing is not enough, We must DO.” –Bruce Lee
*****This trade strategy report is disseminated for “education only” and should not be viewed in any way as a recommendation to buy or sell futures products.”
PAST PERFORMANCE IS NOT NECESSARILY INDICATIVE OF FUTURE RESULTS
IMPORTANT NOTICE! No representation is being made that the use of this strategy or any system or trading methodology will generate profits. Past performance is not necessarily indicative of future results. There is substantial risk of loss associated with trading securities and options on equities. Only risk capital should be used to trade. Trading securities is not suitable for everyone.
Disclaimer: Futures, Options, and Currency trading all have large potential rewards, but they also have large potential risk. You must be aware of the risks and be willing to accept them in order to invest in these markets. Don’t trade with money you can’t afford to lose.
This website is neither a solicitation nor an offer to Buy/Sell futures, options, or currencies. No representation is being made that any account will or is likely to achieve profits or losses similar to those discussed on this web site. The past performance of any trading system or methodology is not necessarily indicative of future results.
CFTC RULE 4.41 –HYPOTHETICAL OR SIMULATED PERFORMANCE RESULTS HAVE CERTAIN LIMITATIONS. UNLIKE AN ACTUAL PERFORMANCE RECORD, SIMULATED RESULTS DO NOT REPRESENT ACTUAL TRADING. ALSO, SINCE THE TRADES HAVE NOT BEEN EXECUTED, THE RESULTS MAY HAVE UNDER-OR-OVER COMPENSATED FOR THE IMPACT, IF ANY, OF CERTAIN MARKET FACTORS, SUCH AS LACK OF LIQUIDITY. SIMULATED TRADING PROGRAMS IN GENERAL ARE ALSO SUBJECT TO THE FACT THAT THEY ARE DESIGNED WITH THE BENEFIT OF HINDSIGHT. NO REPRESENTATION IS BEING MADE THAT ANY ACCOUNT WILL OR IS LIKELY TO ACHIEVE PROFIT OR LOSSES SIMILAR TO THOSE SHOWN