
Markets
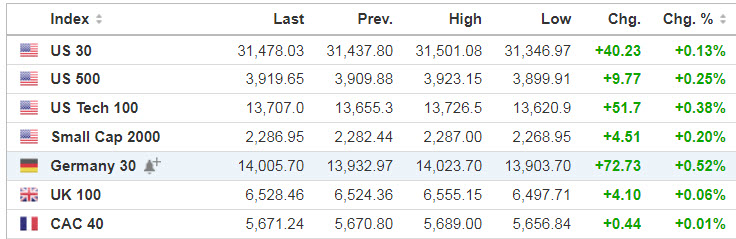
Source: SeekingAlpha.com
Economic Calendar

8:30 Initial Jobless Claims
10:30 EIA Natural Gas Inventory
1:00 PM Results of $27B, 30-Year Note Auction
4:30 PM Money Supply
4:30 PM Fed Balance Sheet
***New: PTG Trading Room Chat Log’s Link
S&P 500

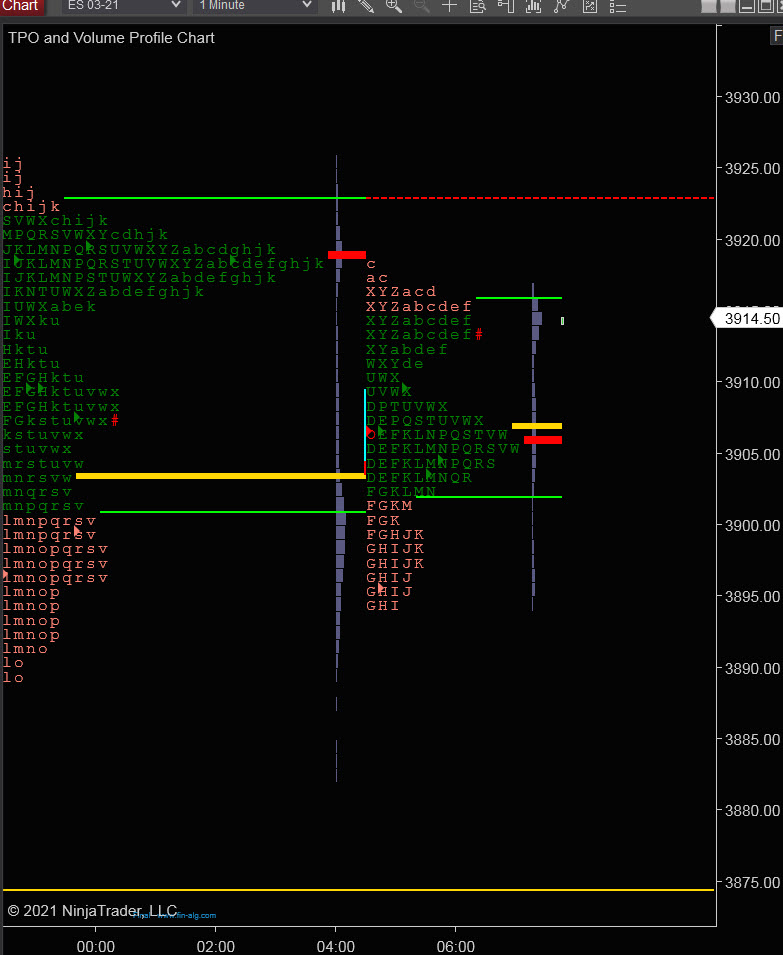
Prior Session was Cycle Day 1 (CD1): Residual momentum rally from prior Cycle continued to push price higher early in the session to fulfill Penetration Levels. When it became apparent that the buyers had dried up, the decline began, reversing lower to fulfill CD1 Average Decline and Violation Levels. Late afternoon recovery pushed price back to 3910 (LIS) into settlement. Range was 50.25 handles on 1.529M contracts exchanged.
…Transition from Cycle Day 1 to Cycle Day 2
This leads us into Cycle Day 2 (CD2): Price is trading within prior range as expectation is for a normal ‘back n fill’ consolidation type day. As such, there are two estimated scenarios to consider for today’s trading.
1.) Price sustains a bid above 3915, initially targets 3925 – 3928 zone.
2.) Price sustains an offer below 3915, initially targets 3905 – 3900 zone.
*****3 Day Cycle has a 91% probability of fulfilling Positive Statistic covering 12 years of recorded tracking history.
PVA High Edge = 3913 PVA Low Edge = 3890 Prior POC = 3900
Range Projections and Key Levels (ES) March 2021 (H) Contract
HOD ATR Range Projection: 3945; LOD ATR Range Projection: 3868; 3 Day Central Pivot: 3905; 3 Day Cycle Target: 3932; 10 Day Average True Range 51; VIX: 22
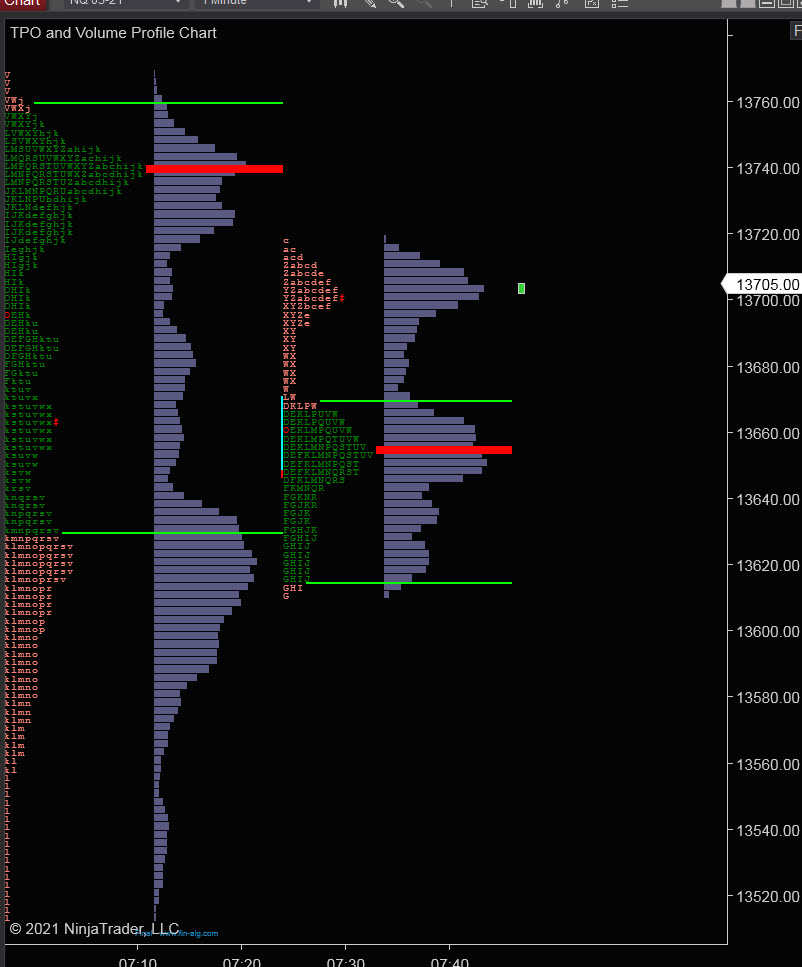
Nasdaq 100 (NQ)

Today is Cycle Day 2 (CD2)…Price is currently trading within prior value zone. Prior Range was 252 handles on 548 contracts exchanged. As such, there are two estimated scenarios to consider for today’s trading.
PVA High Edge = 13763 PVA Low Edge = 13616 Prior POC = 13744
Bull Scenario: IF Bulls sustain a bid above 13700, THEN initial upside estimate targets 13745 – 13765 zone.
Bear Scenario: IF Bears sustain an offer below 13700, THEN initial downside estimate targets 13665 – 13635 zone.
Range Projections and Key Levels (NQ) March 2021 (H) Contract
HOD ATR Range Projection: 13825; LOD ATR Range Projection: 13507; 3 Day Central Pivot: 13665; 3 Day Cycle Target: 13763; 10 Day Average True Range: 212; VIX: 22
Trade Strategy: Our tactical trade strategy will simply remain unaltered…We’ll be flexible to trade both long and short side from Decision Pivot Levels. Continue to focus on Bull/Bear Stackers and Premium/Discounts. As always, remaining in alignment with dominant intra-day force increases probabilities of producing winning trades.
Stay Focused…Non-Biased…Disciplined ALWAYS USE STOPS!
Good Trading…David
“Knowing is not enough, We must APPLY. Willing is not enough, We must DO.” –Bruce Lee
*****This trade strategy report is disseminated for “education only” and should not be viewed in any way as a recommendation to buy or sell futures products.”
PAST PERFORMANCE IS NOT NECESSARILY INDICATIVE OF FUTURE RESULTS
IMPORTANT NOTICE! No representation is being made that the use of this strategy or any system or trading methodology will generate profits. Past performance is not necessarily indicative of future results. There is substantial risk of loss associated with trading securities and options on equities. Only risk capital should be used to trade. Trading securities is not suitable for everyone.
Disclaimer: Futures, Options, and Currency trading all have large potential rewards, but they also have large potential risk. You must be aware of the risks and be willing to accept them in order to invest in these markets. Don’t trade with money you can’t afford to lose.
This website is neither a solicitation nor an offer to Buy/Sell futures, options, or currencies. No representation is being made that any account will or is likely to achieve profits or losses similar to those discussed on this web site. The past performance of any trading system or methodology is not necessarily indicative of future results.
CFTC RULE 4.41 –HYPOTHETICAL OR SIMULATED PERFORMANCE RESULTS HAVE CERTAIN LIMITATIONS. UNLIKE AN ACTUAL PERFORMANCE RECORD, SIMULATED RESULTS DO NOT REPRESENT ACTUAL TRADING. ALSO, SINCE THE TRADES HAVE NOT BEEN EXECUTED, THE RESULTS MAY HAVE UNDER-OR-OVER COMPENSATED FOR THE IMPACT, IF ANY, OF CERTAIN MARKET FACTORS, SUCH AS LACK OF LIQUIDITY. SIMULATED TRADING PROGRAMS IN GENERAL ARE ALSO SUBJECT TO THE FACT THAT THEY ARE DESIGNED WITH THE BENEFIT OF HINDSIGHT. NO REPRESENTATION IS BEING MADE THAT ANY ACCOUNT WILL OR IS LIKELY TO ACHIEVE PROFIT OR LOSSES SIMILAR TO THOSE SHOWN