
Markets
U.S. stock index futures are pulling back from record highs – with the DJIA pointing to an opening loss of 200 points. Denting sentiment are 15,000 new coronavirus infections in China that were calibrated using a new CT scan detection method, rather than confirmation via slower ribonucleic acid tests. That brings the national total to just over 60,000 cases
In Asia, Japan -0.1%. Hong Kong -0.3%. China -0.7%. India -0.3%.
In Europe, at midday, London -1.5%. Paris -1%. Frankfurt -1.1%.
Futures at 6:20, Dow -0.7%. S&P -0.7%. Nasdaq -0.9%. Crude -0.8% to $50.75. Gold +0.4% to $1578. Bitcoin -1.3% to $10189.
Ten-year Treasury Yield -4 bps to 1.58%
Source: Seeking Alpha https://seekingalpha.com/
Economic Calendar
8:30 Initial Jobless Claims
8:30 Consumer Price Index
10:30 EIA Natural Gas Inventory
12:45 PM Fed’s Kaplan Speech
1:00 PM Results of $19B, 30-Year Note Auctio
https://www.investing.com/economic-calendar/
***New: PTG Trading Room Chat Log’s Link
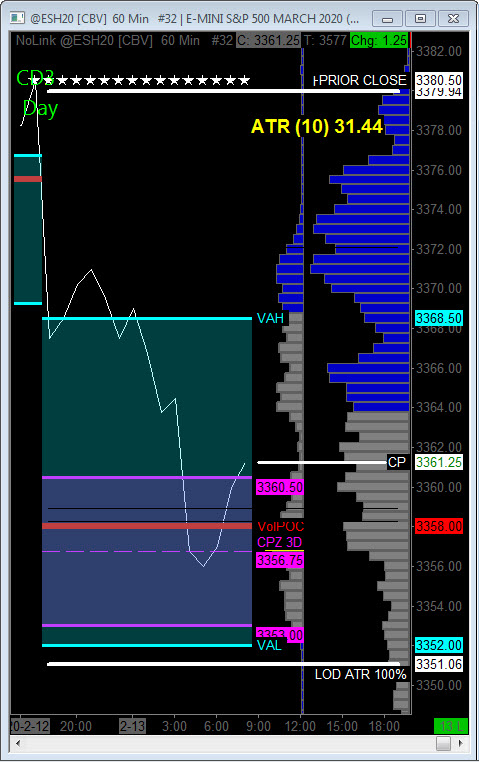
S&P 500
Today is Cycle Day 3 (CD3)…Price continued this cycle’s rally in prior session (CD2), fulfilling 3378 3 Day Rally Objective and Cycle Statistic.
During GLOBEX Session price has declined in excess of 34 handles, exceeding CD3 Average Range of 29 handles, on new scare of exponentially increased COVID-19 cases.
Range High = 3380.00 Range Low = 3350.00 CD3 Range Avg = 29.00
Bull Scenario: IF Bulls hold bid above 3356, THEN initial upside targets 3360 – 3368 zone.
Bear Scenario: IF Bears hold offer below 3356, THEN initial downside targets 3350 – 3345 zone.
Range Projections and Key Levels (ES) March 2020 (H) Contract
HOD ATR Range Projection: 3380.00; LOD ATR Range Projection: 3350.00; 3 Day Central Pivot: 3356.00; 3 Day Cycle Target: 3378.00; 10 Day Average True Range 31.44; VIX: 15.13
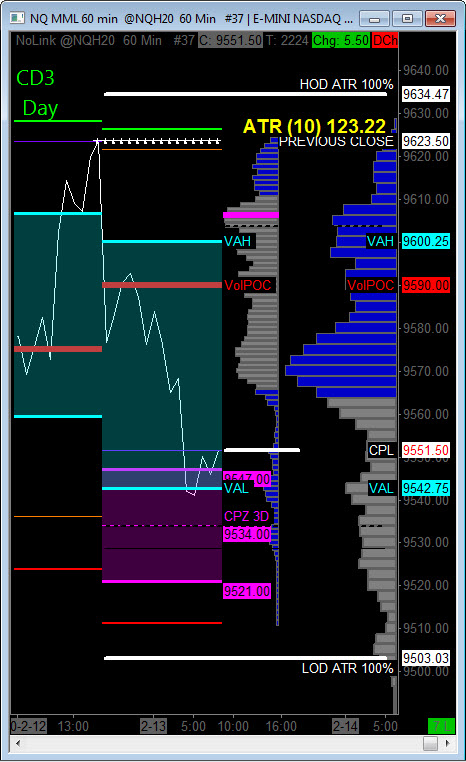
Nasdaq 100 (NQ)
Today is Cycle Day 3 (CD3)…Price failed to exceed CD2 high (9628.25) and has reversed sharply lower during GLOBEX Session, currently within 3 Day Central Pivot Zone (9547 – 9534). Price has fulfilled Positive 3 Day Cycle Statistic which has a 91% probability of occurring each Cycle.
CD1 Range High = 9571.00 CD1 Range Low = 9521.00 CD1 Range Avg = 105.00
Bull Scenario: IF Bulls hold bid above 9543, THEN initial upside targets 9560 – 9565 zone.
Bear Scenario: IF Bears hold offer below 9543, THEN initial downside targets 9534 – 9521 zone.
Range Projections and Key Levels (NQ) March 2020 (H) Contract
HOD ATR Range Projection: 9635.00; LOD ATR Range Projection: 9503.00; 3 Day Central Pivot: 9534.00; 3 Day Cycle Target: 9575.00; 10 Day Average True Range: 123.25; VIX: 15.13
Trade Strategy: Our tactical trade strategy will simply remain unaltered…We’ll be flexible to trade both long and short side from Decision Pivot Levels. Continue to focus on Bull/Bear Stackers and Premium/Discounts. As always, remaining in alignment with dominant intra-day force increases probabilities of producing winning trades.
Stay Focused…Non-Biased…Disciplined ALWAYS USE STOPS!
Good Trading…David
“Knowing is not enough, We must APPLY. Willing is not enough, We must DO.” –Bruce Lee
*****This trade strategy report is disseminated for “education only” and should not be viewed in any way as a recommendation to buy or sell futures products.”
PAST PERFORMANCE IS NOT NECESSARILY INDICATIVE OF FUTURE RESULTS
IMPORTANT NOTICE! No representation is being made that the use of this strategy or any system or trading methodology will generate profits. Past performance is not necessarily indicative of future results. There is substantial risk of loss associated with trading securities and options on equities. Only risk capital should be used to trade. Trading securities is not suitable for everyone.
Disclaimer: Futures, Options, and Currency trading all have large potential rewards, but they also have large potential risk. You must be aware of the risks and be willing to accept them in order to invest in these markets. Don’t trade with money you can’t afford to lose.
This website is neither a solicitation nor an offer to Buy/Sell futures, options, or currencies. No representation is being made that any account will or is likely to achieve profits or losses similar to those discussed on this web site. The past performance of any trading system or methodology is not necessarily indicative of future results.
CFTC RULE 4.41 –HYPOTHETICAL OR SIMULATED PERFORMANCE RESULTS HAVE CERTAIN LIMITATIONS. UNLIKE AN ACTUAL PERFORMANCE RECORD, SIMULATED RESULTS DO NOT REPRESENT ACTUAL TRADING. ALSO, SINCE THE TRADES HAVE NOT BEEN EXECUTED, THE RESULTS MAY HAVE UNDER-OR-OVER COMPENSATED FOR THE IMPACT, IF ANY, OF CERTAIN MARKET FACTORS, SUCH AS LACK OF LIQUIDITY. SIMULATED TRADING PROGRAMS IN GENERAL ARE ALSO SUBJECT TO THE FACT THAT THEY ARE DESIGNED WITH THE BENEFIT OF HINDSIGHT. NO REPRESENTATION IS BEING MADE THAT ANY ACCOUNT WILL OR IS LIKELY TO ACHIEVE PROFIT OR LOSSES SIMILAR TO THOSE SHOWN