
Markets
Nasdaq futures are down 0.8% on the warning from Apple, though the shockwaves weren’t limited to the tech sector, with Dow and S&P 500 futures falling back 0.5%.
Apple slipped 3.3% premarket after becoming the first major U.S. company to say it won’t meet its revenue projections for the current quarter due to the coronavirus outbreak
In Asia, Japan -1.4%. Hong Kong -1.5%. China +0.1%. India -0.4%.
In Europe, at midday, London -1%. Paris -0.5%. Frankfurt -0.8%.
Futures at 6:20, Dow -0.5%. S&P -0.5%. Nasdaq -0.8%. Crude -1.1% to $51.46. Gold +0.3% to $1590.50. Bitcoin -0.9% to $9728.
Ten-year Treasury Yield -5 bps to 1.54%
Source: Seeking Alpha https://seekingalpha.com/
Economic Calendar
8:30 Empire State Mfg Survey
10:00 NAHB Housing Market Index
2:00 PM Fed’s Kashkari Speech
https://www.investing.com/economic-calendar/
***New: PTG Trading Room Chat Log’s Link
S&P 500
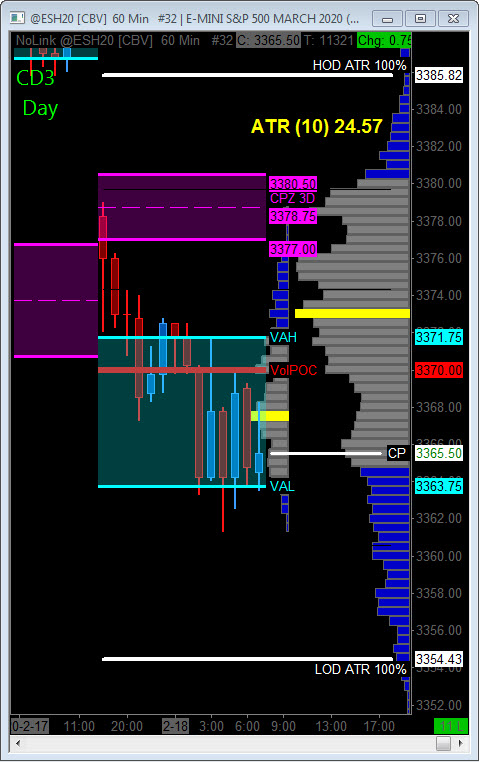
Today is Cycle Day 3 (CD3)…During GLOBEX Session price has declined an average CD3 Range of 30 handles retesting the CD1 Low (3365.25), fulfilling Cycle Statistic.
With the shortened holiday prior session, trading desks will be fully staffed today, so how the RTH Session responds and in particular the Tech Sector will be critical test of bull’s resolve.
Range High = 3385.00 Range Low = 3354.00 CD3 Range Avg = 30.00
Bull Scenario: IF Bulls hold bid above 3365, THEN initial upside targets 3372 – 3375 zone.
Bear Scenario: IF Bears hold offer below 3365, THEN initial downside targets 3355 – 3350 zone.
Range Projections and Key Levels (ES) March 2020 (H) Contract
HOD ATR Range Projection: 3385.00; LOD ATR Range Projection: 3354.00; 3 Day Central Pivot: 3378.00; 3 Day Cycle Target: 3394.00; 10 Day Average True Range 24.50; VIX: 15.18
Nasdaq 100 (NQ)
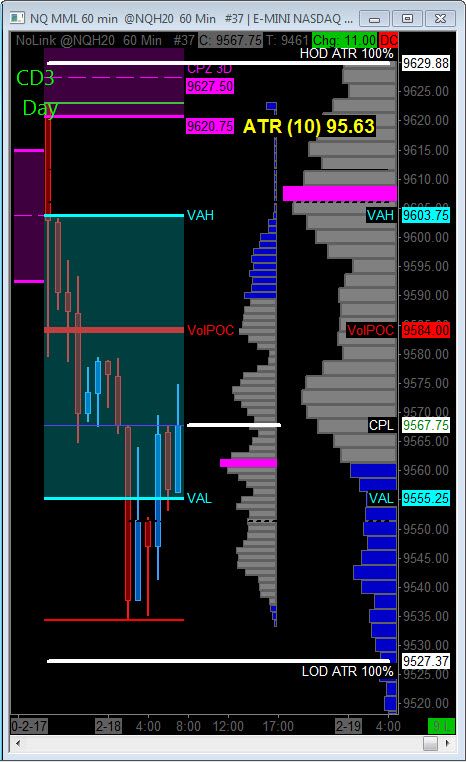
Today is Cycle Day 3 (CD3)…During GLOBEX Session price has declined 153 handles from CD2 high (9687.50) exceeding the CD1 Low (9588). How RTH Session responds to the Apple news will be a critical test of bull’s resolve.
CD3 Range High = 9642.00 CD3 Range Low = 9514.00 CD3 Range Avg = 109.00
Bull Scenario: IF Bulls hold bid above 9562, THEN initial upside targets 9588 – 9595 zone.
Bear Scenario: IF Bears hold offer below 9562, THEN initial downside targets 9535 – 9527 zone.
Range Projections and Key Levels (NQ) March 2020 (H) Contract
HOD ATR Range Projection: 9630.00; LOD ATR Range Projection: 9527.00; 3 Day Central Pivot: 9627.00; 3 Day Cycle Target: 9662.00; 10 Day Average True Range: 95.63; VIX: 15.18
Trade Strategy: Our tactical trade strategy will simply remain unaltered…We’ll be flexible to trade both long and short side from Decision Pivot Levels. Continue to focus on Bull/Bear Stackers and Premium/Discounts. As always, remaining in alignment with dominant intra-day force increases probabilities of producing winning trades.
Stay Focused…Non-Biased…Disciplined ALWAYS USE STOPS!
Good Trading…David
“Knowing is not enough, We must APPLY. Willing is not enough, We must DO.” –Bruce Lee
*****This trade strategy report is disseminated for “education only” and should not be viewed in any way as a recommendation to buy or sell futures products.”
PAST PERFORMANCE IS NOT NECESSARILY INDICATIVE OF FUTURE RESULTS
IMPORTANT NOTICE! No representation is being made that the use of this strategy or any system or trading methodology will generate profits. Past performance is not necessarily indicative of future results. There is substantial risk of loss associated with trading securities and options on equities. Only risk capital should be used to trade. Trading securities is not suitable for everyone.
Disclaimer: Futures, Options, and Currency trading all have large potential rewards, but they also have large potential risk. You must be aware of the risks and be willing to accept them in order to invest in these markets. Don’t trade with money you can’t afford to lose.
This website is neither a solicitation nor an offer to Buy/Sell futures, options, or currencies. No representation is being made that any account will or is likely to achieve profits or losses similar to those discussed on this web site. The past performance of any trading system or methodology is not necessarily indicative of future results.
CFTC RULE 4.41 –HYPOTHETICAL OR SIMULATED PERFORMANCE RESULTS HAVE CERTAIN LIMITATIONS. UNLIKE AN ACTUAL PERFORMANCE RECORD, SIMULATED RESULTS DO NOT REPRESENT ACTUAL TRADING. ALSO, SINCE THE TRADES HAVE NOT BEEN EXECUTED, THE RESULTS MAY HAVE UNDER-OR-OVER COMPENSATED FOR THE IMPACT, IF ANY, OF CERTAIN MARKET FACTORS, SUCH AS LACK OF LIQUIDITY. SIMULATED TRADING PROGRAMS IN GENERAL ARE ALSO SUBJECT TO THE FACT THAT THEY ARE DESIGNED WITH THE BENEFIT OF HINDSIGHT. NO REPRESENTATION IS BEING MADE THAT ANY ACCOUNT WILL OR IS LIKELY TO ACHIEVE PROFIT OR LOSSES SIMILAR TO THOSE SHOWN