
Markets
S&P 500 and Nasdaq notched new closing highs on Wednesday, though stock index futures are now debating direction after inching between gains and losses overnight.
The FOMC viewed “current stance of monetary policy” as “appropriate to support sustained expansion of economic activity, strong labor market conditions, and inflation returning to the committee’s symmetric 2% objective,” according to the minutes of its Jan. 28-29 meeting.
In Asia, Japan +0.3%. Hong Kong -0.2%. China +1.8%. India -0.4%.
In Europe, at midday, London flat. Paris -0.2%. Frankfurt -0.1%.
Futures at 6:20, Dow -0.1%. S&P -0.1%. Nasdaq -0.1%. Crude +0.4% to $53.70. Gold +0.1% to $1614. Bitcoin -5.4% to $9611.
Ten-year Treasury Yield -3 bps to 1.54%
Source: Seeking Alpha https://seekingalpha.com/
Economic Calendar
8:30 Initial Jobless Claims
8:30 Philly Fed Business Outlook
10:00 Leading Indicators
10:30 EIA Natural Gas Inventory
11:00 EIA Petroleum Inventories
https://www.investing.com/economic-calendar/
***New: PTG Trading Room Chat Log’s Link
S&P 500
Today is Cycle Day 2 (CD2)…Rally which began from CD3 low continued into CD1 fulfilling upside objectives. Expectation for today is for a “normal” ‘back n fill’ price action to absorb recent rally gains. Retest of CD1 Low (3370.75) is certainly possible to make sure it’s “secure”.
CD2 Range High = 3401.00 CD2 Range Low = 3373.00 CD2 Range Avg = 27.25
Bull Scenario: IF Bulls hold bid above 3380, THEN initial upside targets 3388 – 3392 zone
Bear Scenario: IF Bears hold offer below 3380, THEN initial downside targets 3373 – 3370 zone.
Range Projections and Key Levels (ES) March 2020 (H) Contract
HOD ATR Range Projection: 3402.00; LOD ATR Range Projection: 3372.00; 3 Day Central Pivot: 3380.00; 3 Day Cycle Target: 3399.50; 10 Day Average True Range 25.55; VIX: 14.93

Nasdaq 100 (NQ)
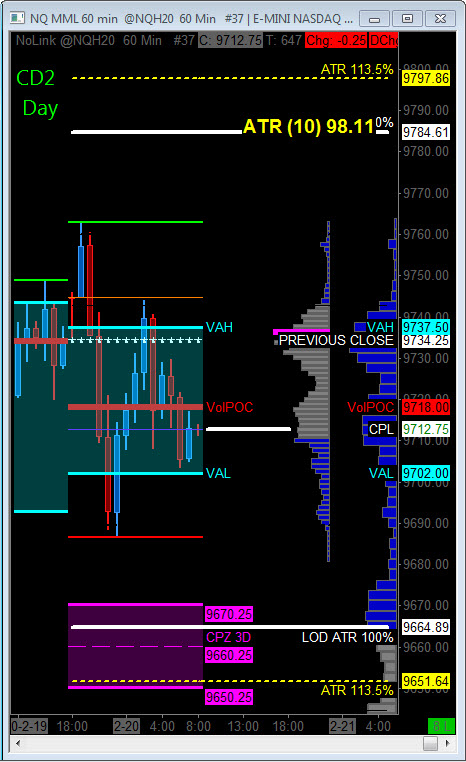
Today is Cycle Day 2 (CD1)…Price has fulfilled Cycle objectives and as such expectation for today would be for normal “back n fill” price action with an upside bias holding above 3 Day Central Pivot Zone.
CD2 Range High = 9748.00 CD2 Range Low = 9702.00 CD2 Range Avg = 101.50
Bull Scenario: IF Bulls hold bid above 9718, THEN initial upside targets 9734 – 9748 zone.
Bear Scenario: IF Bears hold offer below 9718, THEN initial downside targets 9693 – 9686 zone.
Range Projections and Key Levels (NQ) March 2020 (H) Contract
HOD ATR Range Projection: 9785.00; LOD ATR Range Projection: 9665.00; 3 Day Central Pivot: 9660.00; 3 Day Cycle Target: 9715.00; 10 Day Average True Range: 98.00; VIX: 14.93
Trade Strategy: Our tactical trade strategy will simply remain unaltered…We’ll be flexible to trade both long and short side from Decision Pivot Levels. Continue to focus on Bull/Bear Stackers and Premium/Discounts. As always, remaining in alignment with dominant intra-day force increases probabilities of producing winning trades.
Stay Focused…Non-Biased…Disciplined ALWAYS USE STOPS!
Good Trading…David
“Knowing is not enough, We must APPLY. Willing is not enough, We must DO.” –Bruce Lee
*****This trade strategy report is disseminated for “education only” and should not be viewed in any way as a recommendation to buy or sell futures products.”
PAST PERFORMANCE IS NOT NECESSARILY INDICATIVE OF FUTURE RESULTS
IMPORTANT NOTICE! No representation is being made that the use of this strategy or any system or trading methodology will generate profits. Past performance is not necessarily indicative of future results. There is substantial risk of loss associated with trading securities and options on equities. Only risk capital should be used to trade. Trading securities is not suitable for everyone.
Disclaimer: Futures, Options, and Currency trading all have large potential rewards, but they also have large potential risk. You must be aware of the risks and be willing to accept them in order to invest in these markets. Don’t trade with money you can’t afford to lose.
This website is neither a solicitation nor an offer to Buy/Sell futures, options, or currencies. No representation is being made that any account will or is likely to achieve profits or losses similar to those discussed on this web site. The past performance of any trading system or methodology is not necessarily indicative of future results.
CFTC RULE 4.41 –HYPOTHETICAL OR SIMULATED PERFORMANCE RESULTS HAVE CERTAIN LIMITATIONS. UNLIKE AN ACTUAL PERFORMANCE RECORD, SIMULATED RESULTS DO NOT REPRESENT ACTUAL TRADING. ALSO, SINCE THE TRADES HAVE NOT BEEN EXECUTED, THE RESULTS MAY HAVE UNDER-OR-OVER COMPENSATED FOR THE IMPACT, IF ANY, OF CERTAIN MARKET FACTORS, SUCH AS LACK OF LIQUIDITY. SIMULATED TRADING PROGRAMS IN GENERAL ARE ALSO SUBJECT TO THE FACT THAT THEY ARE DESIGNED WITH THE BENEFIT OF HINDSIGHT. NO REPRESENTATION IS BEING MADE THAT ANY ACCOUNT WILL OR IS LIKELY TO ACHIEVE PROFIT OR LOSSES SIMILAR TO THOSE SHOWN