
Markets
In Asia, Japan +0.14%. Hong Kong +0.21%. China closed. India +1.17%.
In Europe, at midday, London -0.18%. Paris -0.14%. Frankfurt -0.35%.
Futures at 5:30, Dow -0.19%. S&P -0.17%. Nasdaq -0.17%. Crude -1.36% to $52.93. Gold -0.09% to $1,318. Bitcoin -2% to $3,440.
Ten-year Treasury Yield -2 bps to 2.684%.
Source: Seeking Alpha
7:00 MBA Mortgage Applications
8:30 International Trade
8:30 Productivity and Costs
10:30 EIA Petroleum Inventories
1:00 PM Results of $27B, 10-Year Note Auction
6:05 PM Fed’s Quarles Speech
7:00 PM Jerome Powell Speech
***New: PTG Trading Room Chat Log’s Link
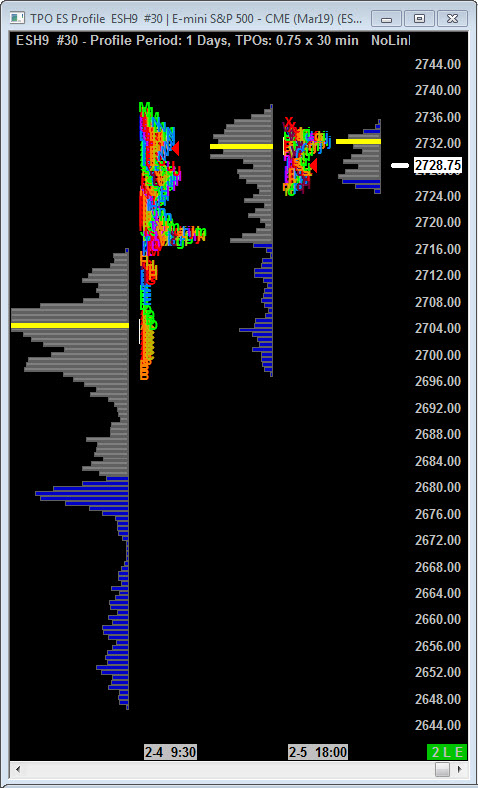
S&P 500
Today is Cycle Day 1 (CD1)…Normal is for a decline measuring 2714.00. Average Range for CD1 is 23.75 handles. Odds of decline > 10 handles = 72% Odds of decline > 20 = 42%
CD1 Range High = 2748.00 CD1 Range Low = 2711.50 CD1 Range Avg = 23.75
Scenario 1: IF price holds bid above 2725, THEN initial upside targets 2737.75 (CD3 High). Conversion of this level measures 2739 – 2741.50 STATX Zone.
Scenario 2: IF price holds offer below 2725, THEN initial downside targets 2717.25 – 2714.75 3 Day Central Pivot and overlapping 2717.50 -2715 STATX Zone.
Range Projections and Key Levels (ES) March 2019 (H) Contract
HOD ATR Range Projection: 2752.75; LOD ATR Range Projection: 2706.75; 3 Day Central Pivot: 2716.00; 3 Day Cycle Target: 2752.00; 10 Day Average True Range 28.50; VIX: 15.40
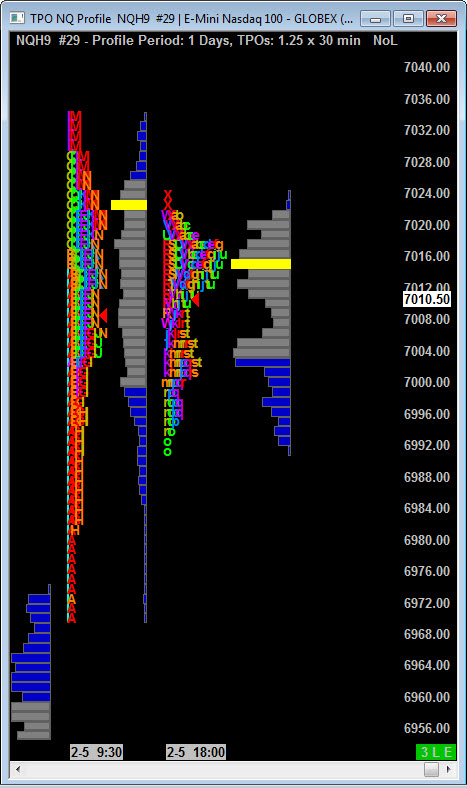
Nasdaq 100 (NQ)
Today is Cycle Day 1 (CD1)…Normal is for a decline measuring 6979.50. Average Range for CD1 is 54.50 handles. Odds of decline > 20 handles = 73% Odds of decline > 25 = 64%
CD1 Range High = 7045.00 CD1 Range Low = 6970.00 CD1 Range Avg = 54.50
Scenario 1: IF price holds bid above 7000, THEN initial upside targets 7024.25 – 7033.75 zone. Conversion of this zone measures 7045.00 – 7054.00 CD1 Penetration Range Zone.
Scenario 2: IF price holds offer below 7000, THEN initial downside targets 6981.00 – 6969.75 CD1 Violation Range Zone.
Range Projections and Key Levels (NQ) March 2019 (H) Contract
HOD ATR Range Projection: 7095.00; LOD ATR Range Projection: 6920.50; 3 Day Central Pivot: 6936.50; 3 Day Cycle Target: 7058.50; 10 Day Average True Range: 103.75; VIX: 15.40
Trade Strategy: Our tactical trade strategy will simply remain unaltered…We’ll be flexible to trade both long and short side from Decision Pivot Levels. Continue to focus on Bull/Bear Stackers and Premium/Discounts. As always, remaining in alignment with dominant intra-day force increases probabilities of producing winning trades.
Stay Focused…Non-Biased…Disciplined ALWAYS USE STOPS!
Good Trading…David
“Knowing is not enough, We must APPLY. Willing is not enough, We must DO.” –Bruce Lee
*****This trade strategy report is disseminated for “education only” and should not be viewed in any way as a recommendation to buy or sell futures products.”
PAST PERFORMANCE IS NOT NECESSARILY INDICATIVE OF FUTURE RESULTS
IMPORTANT NOTICE! No representation is being made that the use of this strategy or any system or trading methodology will generate profits. Past performance is not necessarily indicative of future results. There is substantial risk of loss associated with trading securities and options on equities. Only risk capital should be used to trade. Trading securities is not suitable for everyone.
Disclaimer: Futures, Options, and Currency trading all have large potential rewards, but they also have large potential risk. You must be aware of the risks and be willing to accept them in order to invest in these markets. Don’t trade with money you can’t afford to lose.
This website is neither a solicitation nor an offer to Buy/Sell futures, options, or currencies. No representation is being made that any account will or is likely to achieve profits or losses similar to those discussed on this web site. The past performance of any trading system or methodology is not necessarily indicative of future results.
CFTC RULE 4.41 –HYPOTHETICAL OR SIMULATED PERFORMANCE RESULTS HAVE CERTAIN LIMITATIONS. UNLIKE AN ACTUAL PERFORMANCE RECORD, SIMULATED RESULTS DO NOT REPRESENT ACTUAL TRADING. ALSO, SINCE THE TRADES HAVE NOT BEEN EXECUTED, THE RESULTS MAY HAVE UNDER-OR-OVER COMPENSATED FOR THE IMPACT, IF ANY, OF CERTAIN MARKET FACTORS, SUCH AS LACK OF LIQUIDITY. SIMULATED TRADING PROGRAMS IN GENERAL ARE ALSO SUBJECT TO THE FACT THAT THEY ARE DESIGNED WITH THE BENEFIT OF HINDSIGHT. NO REPRESENTATION IS BEING MADE THAT ANY ACCOUNT WILL OR IS LIKELY TO ACHIEVE PROFIT OR LOSSES SIMILAR TO THOSE SHOWN