
Markets
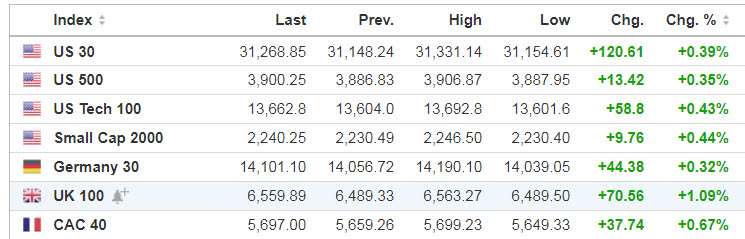
Source: SeekingAlpha.com
Economic Calendar
12:00 PM Fed’s Mester Speech
12:30 PM Investor Movement Index
***New: PTG Trading Room Chat Log’s Link
S&P 500

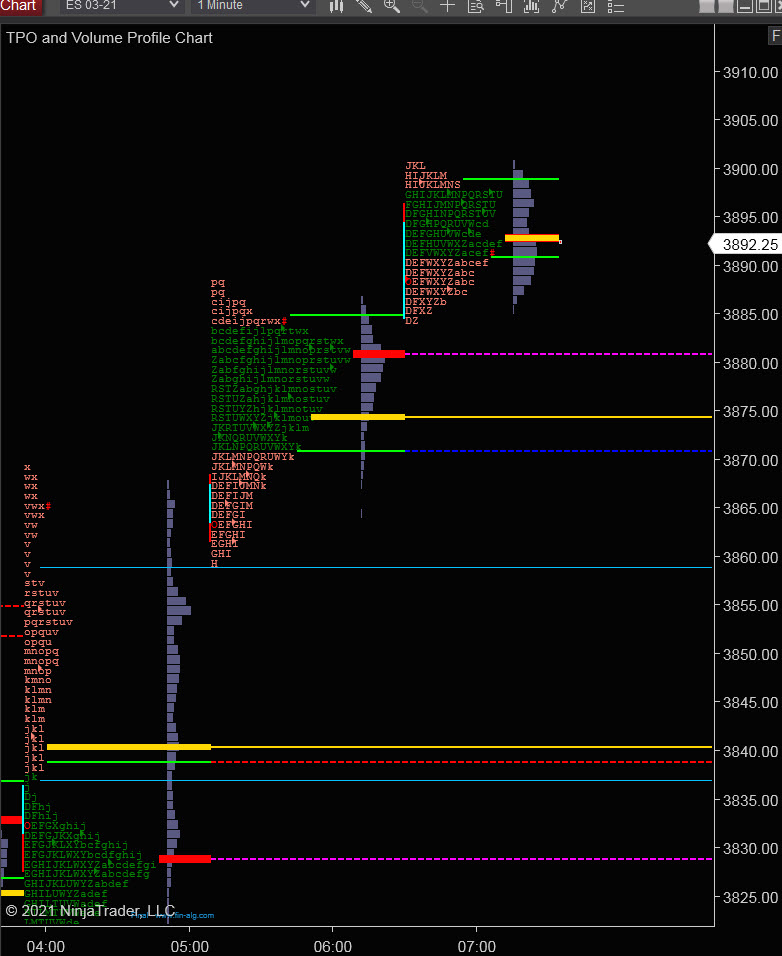
Prior Session was Cycle Day 1 (CD1): Price produced only a shallow decline during overnight session with a gap open higher for RTH. Early pullback filled and held gap, then price proceeded to grind higher, producing a balanced distribution profile. Range was 28.25 handles on 1.036M contracts exchanged.
…Transition from Cycle Day 1 to Cycle Day 2
This leads us into Cycle Day 2 (CD2): Price is trading above prior range fulfilling upper CD3 Penetration Level (3898) during Globex Session. Bulls will need to continue holding above PH (3888.25) to keep this rally flowing. Violation and conversion back below this level could produce a deeper decline into prior range. As such, there are two estimated scenarios to consider for today’s trading.
1.) Price sustains a bid above 3890, initially targets 3900 – 3902 zone.
2.) Price sustains an offer below 3890, initially targets 3882 – 3880 zone.
*****3 Day Cycle has a 91% probability of fulfilling Positive Statistic covering 12 years of recorded tracking history.
PVA High Edge = 3882 PVA Low Edge = 3875 Prior POC = 3880
Range Projections and Key Levels (ES) March 2021 (H) Contract
HOD ATR Range Projection: 3947; LOD ATR Range Projection: 3838; 3 Day Central Pivot: 3851; 3 Day Cycle Target: 3914; 10 Day Average True Range 61; VIX: 22
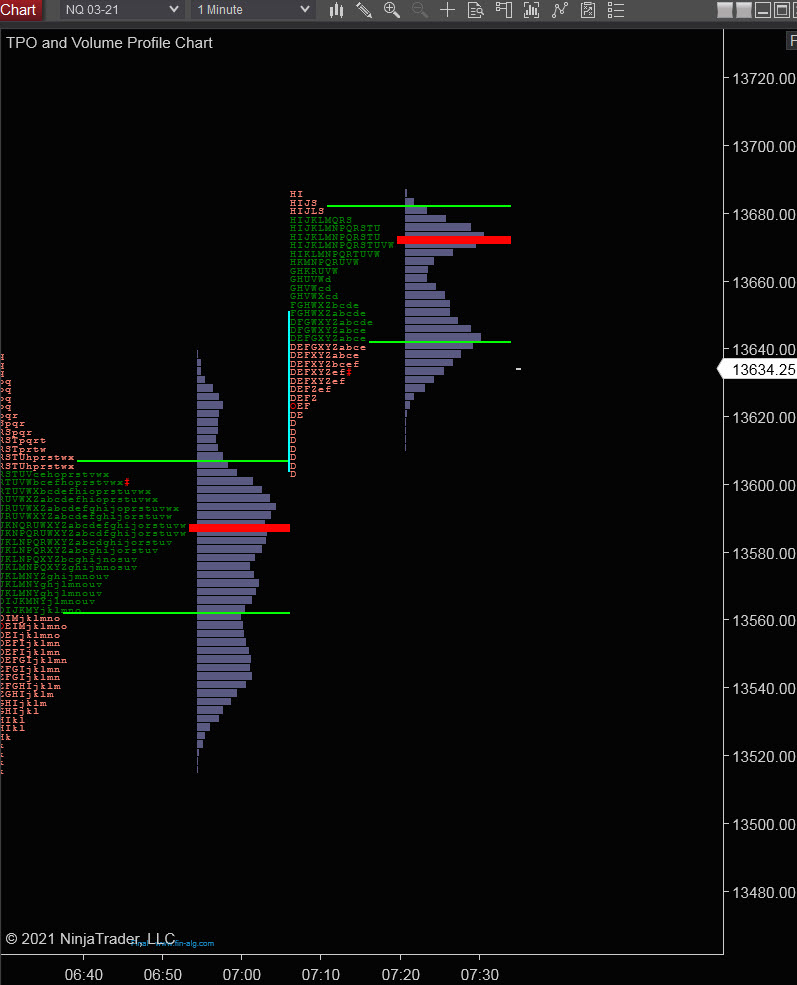
Nasdaq 100 (NQ)

Today is Cycle Day 2 (CD2)…Price is currently trading above prior value zone having fulfilled CD2 Penetration Level (13668) during Globex Session. Prior Range was 119 handles on 415 contracts exchanged. As such, there are two estimated scenarios to consider for today’s trading.
PVA High Edge = 13605 PVA Low Edge = 13550 Prior POC = 13593
Bull Scenario: IF Bulls sustain a bid above 13638, THEN initial upside estimate targets 13656 – 13668 zone.
Bear Scenario: IF Bears sustain an offer below 13638, THEN initial downside estimate targets 13615 – 13605 zone.
Range Projections and Key Levels (NQ) March 2021 (H) Contract
HOD ATR Range Projection: 13868; LOD ATR Range Projection: 13424; 3 Day Central Pivot: 13513; 3 Day Cycle Target: 13776; 10 Day Average True Range: 263; VIX: 22
Trade Strategy: Our tactical trade strategy will simply remain unaltered…We’ll be flexible to trade both long and short side from Decision Pivot Levels. Continue to focus on Bull/Bear Stackers and Premium/Discounts. As always, remaining in alignment with dominant intra-day force increases probabilities of producing winning trades.
Stay Focused…Non-Biased…Disciplined ALWAYS USE STOPS!
Good Trading…David
“Knowing is not enough, We must APPLY. Willing is not enough, We must DO.” –Bruce Lee
*****This trade strategy report is disseminated for “education only” and should not be viewed in any way as a recommendation to buy or sell futures products.”
PAST PERFORMANCE IS NOT NECESSARILY INDICATIVE OF FUTURE RESULTS
IMPORTANT NOTICE! No representation is being made that the use of this strategy or any system or trading methodology will generate profits. Past performance is not necessarily indicative of future results. There is substantial risk of loss associated with trading securities and options on equities. Only risk capital should be used to trade. Trading securities is not suitable for everyone.
Disclaimer: Futures, Options, and Currency trading all have large potential rewards, but they also have large potential risk. You must be aware of the risks and be willing to accept them in order to invest in these markets. Don’t trade with money you can’t afford to lose.
This website is neither a solicitation nor an offer to Buy/Sell futures, options, or currencies. No representation is being made that any account will or is likely to achieve profits or losses similar to those discussed on this web site. The past performance of any trading system or methodology is not necessarily indicative of future results.
CFTC RULE 4.41 –HYPOTHETICAL OR SIMULATED PERFORMANCE RESULTS HAVE CERTAIN LIMITATIONS. UNLIKE AN ACTUAL PERFORMANCE RECORD, SIMULATED RESULTS DO NOT REPRESENT ACTUAL TRADING. ALSO, SINCE THE TRADES HAVE NOT BEEN EXECUTED, THE RESULTS MAY HAVE UNDER-OR-OVER COMPENSATED FOR THE IMPACT, IF ANY, OF CERTAIN MARKET FACTORS, SUCH AS LACK OF LIQUIDITY. SIMULATED TRADING PROGRAMS IN GENERAL ARE ALSO SUBJECT TO THE FACT THAT THEY ARE DESIGNED WITH THE BENEFIT OF HINDSIGHT. NO REPRESENTATION IS BEING MADE THAT ANY ACCOUNT WILL OR IS LIKELY TO ACHIEVE PROFIT OR LOSSES SIMILAR TO THOSE SHOWN