
Markets
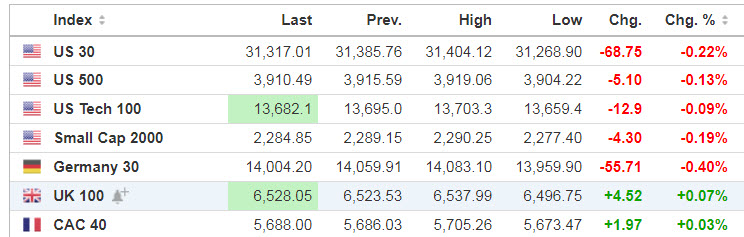
Source: SeekingAlpha.com
Economic Calendar
8:55 Redbook Chain Store Sales
10:00 Job Openings and Labor Turnover Survey
12:00 PM Fed’s Bullard: “2021 Dow Lecture: U.S. Economy and Monetary Policy”
1:00 PM Results of $58B, 3-Year Note Auction
https://www.investing.com/economic-calendar/
***New: PTG Trading Room Chat Log’s Link
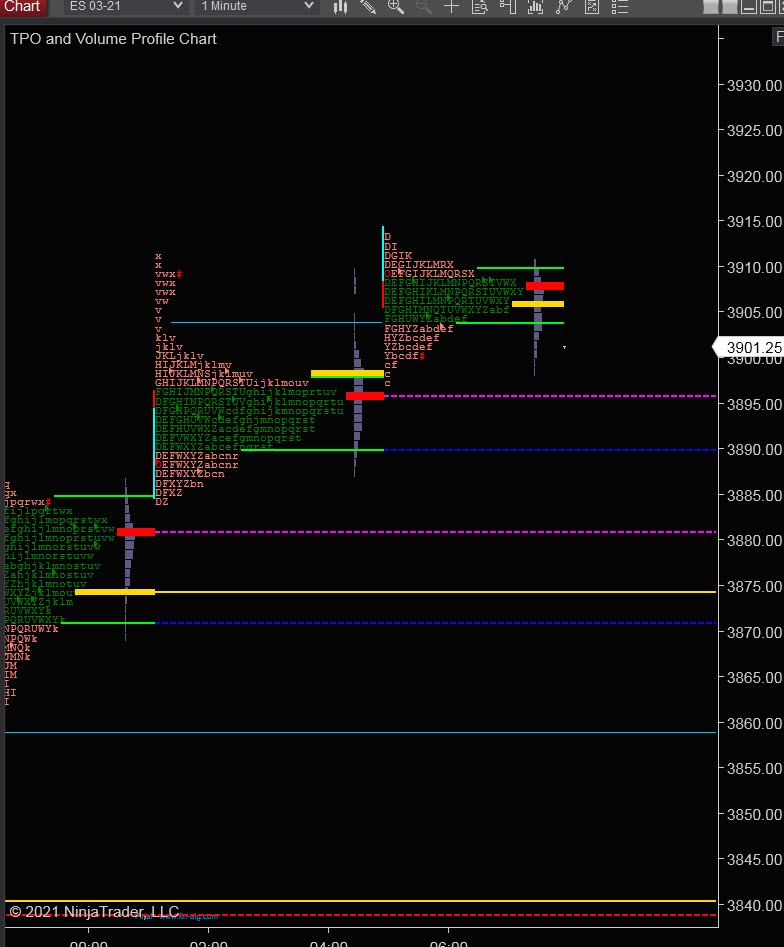
S&P 500

Prior Session was Cycle Day 2 (CD2): Normal CD2 trade action did unfold as expected, with price balancing above prior value zone. Range was 25.75 handles on 936k contracts exchanged.
…Transition from Cycle Day 2 to Cycle Day 3
This leads us into Cycle Day 3 (CD3): Price is holding bid above prior value zone and Cycle Statistic has been fulfilled. Primary trend remains bullish with new ATH being notched daily. 3 Day Central Pivot Zone is key structural support trend, so until there is a bearish shift in this zone, bias remains in bullish camp. As such, there are two estimated scenarios to consider for today’s trading.
1.) Price sustains a bid above 3900, initially targets 3910 – 3915 zone.
2.) Price sustains an offer below 3900, initially targets 3890 – 3885 zone.
*****3 Day Cycle has a 91% probability of fulfilling Positive Statistic covering 12 years of recorded tracking history.
PVA High Edge = 3900 PVA Low Edge = 3892 Prior POC = 3898
Range Projections and Key Levels (ES) March 2021 (H) Contract
HOD ATR Range Projection: 3956; LOD ATR Range Projection: 3855; 3 Day Central Pivot: 3876; 3 Day Cycle Target: 3923; 10 Day Average True Range 58; VIX: 22
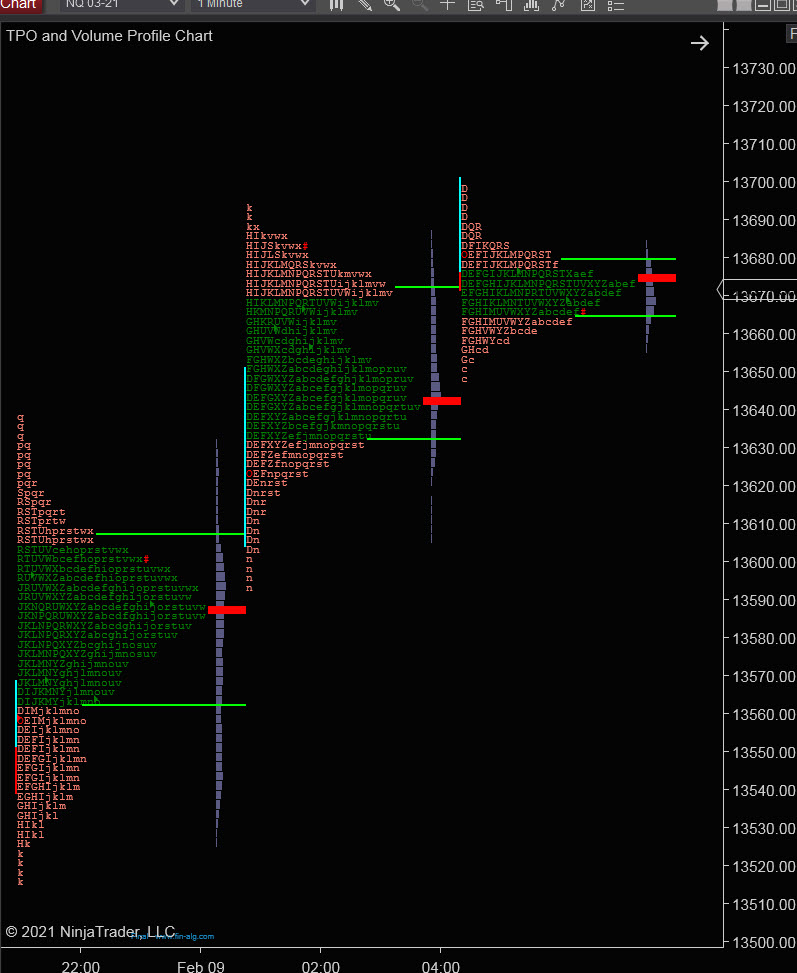
Nasdaq 100 (NQ)

Today is Cycle Day 3 (CD3)…Price is currently trading at upperedge of prior value zone. Prior range was 97 handles on 390k contracts exchanged. As such, there are two estimated scenarios to consider for today’s trading.
PVA High Edge = 13671 PVA Low Edge = 13634 Prior POC = 13648
Bull Scenario: IF Bulls sustain a bid above 13670, THEN initial upside estimate targets 13698 – 13723 zone.
Bear Scenario: IF Bears sustain an offer below 13670, THEN initial downside estimate targets 13650 – 13630 zone.
Range Projections and Key Levels (NQ) March 2021 (H) Contract
HOD ATR Range Projection: 13887; LOD ATR Range Projection: 13461; 3 Day Central Pivot: 13578; 3 Day Cycle Target: 13812; 10 Day Average True Range: 236; VIX: 22
Trade Strategy: Our tactical trade strategy will simply remain unaltered…We’ll be flexible to trade both long and short side from Decision Pivot Levels. Continue to focus on Bull/Bear Stackers and Premium/Discounts. As always, remaining in alignment with dominant intra-day force increases probabilities of producing winning trades.
Stay Focused…Non-Biased…Disciplined ALWAYS USE STOPS!
Good Trading…David
“Knowing is not enough, We must APPLY. Willing is not enough, We must DO.” –Bruce Lee
*****This trade strategy report is disseminated for “education only” and should not be viewed in any way as a recommendation to buy or sell futures products.”
PAST PERFORMANCE IS NOT NECESSARILY INDICATIVE OF FUTURE RESULTS
IMPORTANT NOTICE! No representation is being made that the use of this strategy or any system or trading methodology will generate profits. Past performance is not necessarily indicative of future results. There is substantial risk of loss associated with trading securities and options on equities. Only risk capital should be used to trade. Trading securities is not suitable for everyone.
Disclaimer: Futures, Options, and Currency trading all have large potential rewards, but they also have large potential risk. You must be aware of the risks and be willing to accept them in order to invest in these markets. Don’t trade with money you can’t afford to lose.
This website is neither a solicitation nor an offer to Buy/Sell futures, options, or currencies. No representation is being made that any account will or is likely to achieve profits or losses similar to those discussed on this web site. The past performance of any trading system or methodology is not necessarily indicative of future results.
CFTC RULE 4.41 –HYPOTHETICAL OR SIMULATED PERFORMANCE RESULTS HAVE CERTAIN LIMITATIONS. UNLIKE AN ACTUAL PERFORMANCE RECORD, SIMULATED RESULTS DO NOT REPRESENT ACTUAL TRADING. ALSO, SINCE THE TRADES HAVE NOT BEEN EXECUTED, THE RESULTS MAY HAVE UNDER-OR-OVER COMPENSATED FOR THE IMPACT, IF ANY, OF CERTAIN MARKET FACTORS, SUCH AS LACK OF LIQUIDITY. SIMULATED TRADING PROGRAMS IN GENERAL ARE ALSO SUBJECT TO THE FACT THAT THEY ARE DESIGNED WITH THE BENEFIT OF HINDSIGHT. NO REPRESENTATION IS BEING MADE THAT ANY ACCOUNT WILL OR IS LIKELY TO ACHIEVE PROFIT OR LOSSES SIMILAR TO THOSE SHOWN