
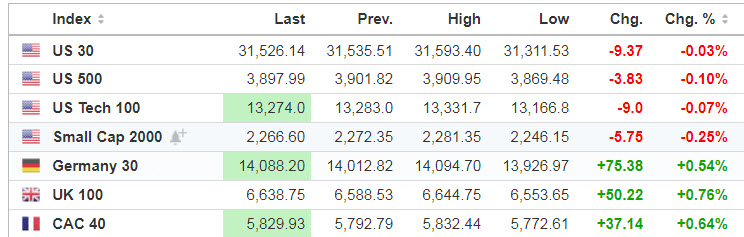
Markets
Volatility may be making a comeback on Wall Street as stock index futures fell back overnight, down about 0.5%, following one of the best days since June. On Monday, the S&P 500 climbed 2.4%, the DJIA tacked on another 2%, while the tech-heavy Nasdaq Composite jumped over 3% after shedding 4.9% last week. The 10-year U.S. Treasury note yield, which is keeping investors on edge, also slipped to a session low of 1.41% before drifting toward the flatline.
Source: SeekingAlpha.com
Economic Calendar
8:55 Redbook Chain Store Sales
https://www.investing.com/economic-calendar/
***New: PTG Trading Room Chat Log’s Link
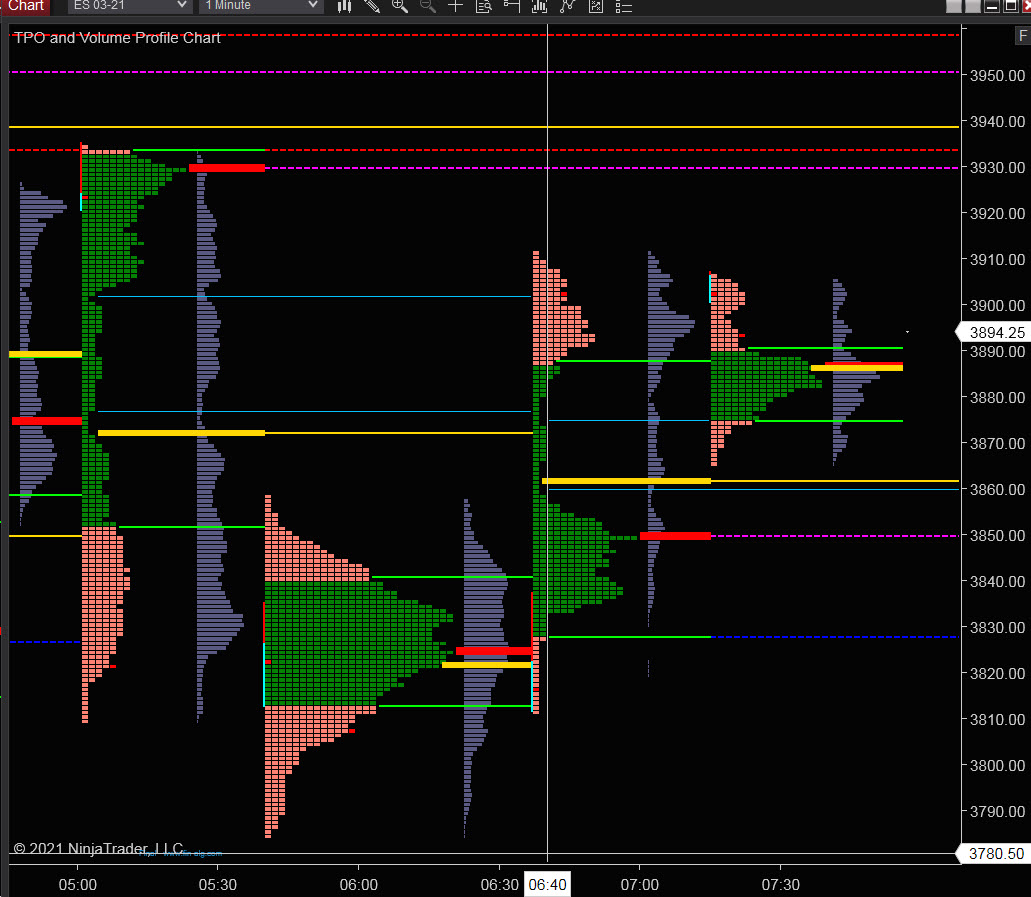
S&P 500

Prior Session was Cycle Day 2 (CD2): Trader Vic Gap Rule (TVGR) opened the session and never looked back, as price rallied surpassing cycle objectives. Range was 99.50 handles on 1.628M contracts exchanged.
…Transition from Cycle Day 2 to Cycle Day 3
This leads us into Cycle Day 3 (CD3): We’ll mark today’s session as a “wild-card” since cycle objectives have been fulfilled. Bulls are in control and within striking distance of all-time highs, so a conversion above CD2 range would help propel price higher. Failure to sustain a bid above prior high (3912) may induce some selling to absorb recent rally. As such, there are two estimated scenarios to consider for today’s trading.
1.) Price sustains a bid above 3895, initially targets 3912 – 3930 zone.
2.) Price sustains an offer below 3895, initially targets 3870 – 3855 zone.
*****3 Day Cycle has a 91% probability of fulfilling Positive Statistic covering 12 years of recorded tracking history.
PVA High Edge = 3912 PVA Low Edge = 3870 Prior POC = 3895
Range Projections and Key Levels (ES) March 2021 (H) Contract
HOD ATR Range Projection: 3929; LOD ATR Range Projection: 3844; 3 Day Central Pivot: 3850; 3 Day Cycle Target: 3851; 10 Day Average True Range 62; VIX: 23
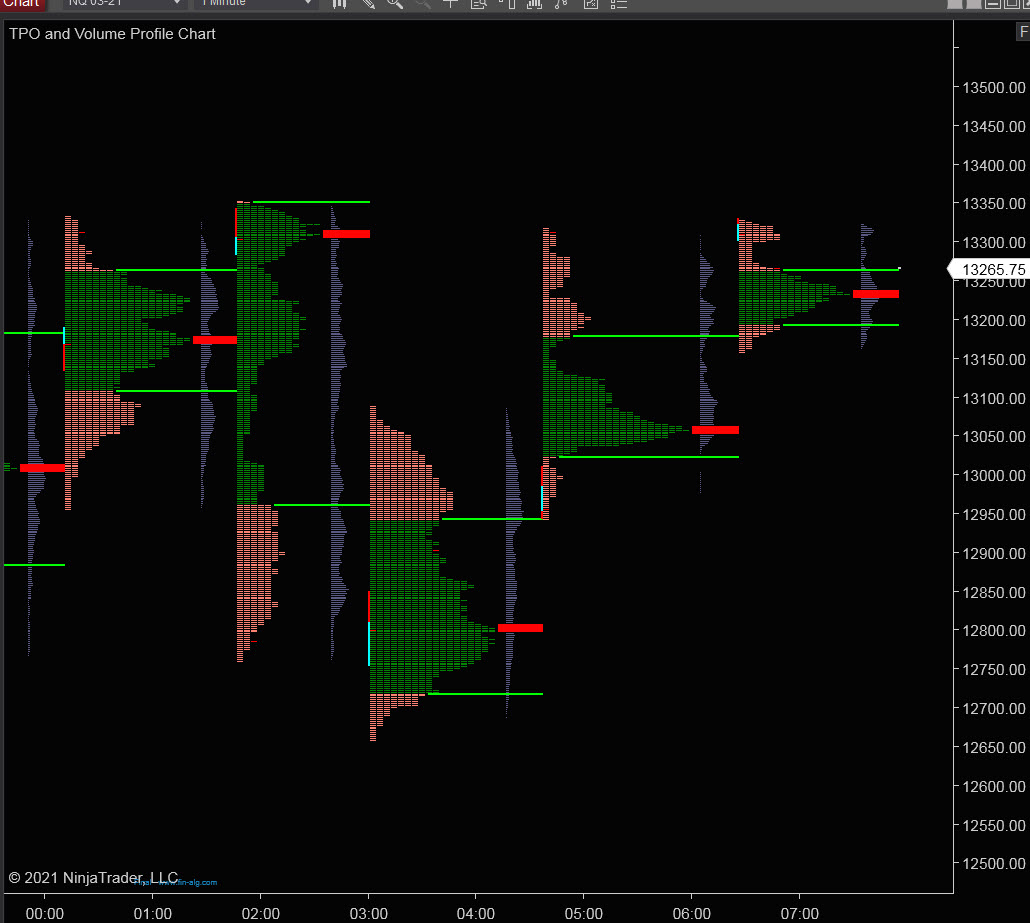
Nasdaq 100 (NQ)

Today is Cycle Day 3 (CD3)…Price is currently trading above prior value zone. Prior range was 372 handles on 505k contracts exchanged. As such, there are two estimated scenarios to consider for today’s trading.
PVA High Edge = 13208 PVA Low Edge = 13033 Prior POC = 13095
Bull Scenario: IF Bulls sustain a bid above 13230, THEN initial upside estimate targets 13265 – 13318 zone.
Bear Scenario: IF Bears sustain an offer below 13230, THEN initial downside estimate targets 13190 – 13160 zone.
Range Projections and Key Levels (NQ) March 2021 (H) Contract
HOD ATR Range Projection: 13487; LOD ATR Range Projection: 13003; 3 Day Central Pivot: 13014; 3 Day Cycle Target: 12960; 10 Day Average True Range: 325; VIX: 23
Trade Strategy: Our tactical trade strategy will simply remain unaltered…We’ll be flexible to trade both long and short side from Decision Pivot Levels. Continue to focus on Bull/Bear Stackers and Premium/Discounts. As always, remaining in alignment with dominant intra-day force increases probabilities of producing winning trades.
Stay Focused…Non-Biased…Disciplined ALWAYS USE STOPS!
Good Trading…David
“Knowing is not enough, We must APPLY. Willing is not enough, We must DO.” –Bruce Lee
*****This trade strategy report is disseminated for “education only” and should not be viewed in any way as a recommendation to buy or sell futures products.”
PAST PERFORMANCE IS NOT NECESSARILY INDICATIVE OF FUTURE RESULTS
IMPORTANT NOTICE! No representation is being made that the use of this strategy or any system or trading methodology will generate profits. Past performance is not necessarily indicative of future results. There is substantial risk of loss associated with trading securities and options on equities. Only risk capital should be used to trade. Trading securities is not suitable for everyone.
Disclaimer: Futures, Options, and Currency trading all have large potential rewards, but they also have large potential risk. You must be aware of the risks and be willing to accept them in order to invest in these markets. Don’t trade with money you can’t afford to lose.
This website is neither a solicitation nor an offer to Buy/Sell futures, options, or currencies. No representation is being made that any account will or is likely to achieve profits or losses similar to those discussed on this web site. The past performance of any trading system or methodology is not necessarily indicative of future results.
CFTC RULE 4.41 –HYPOTHETICAL OR SIMULATED PERFORMANCE RESULTS HAVE CERTAIN LIMITATIONS. UNLIKE AN ACTUAL PERFORMANCE RECORD, SIMULATED RESULTS DO NOT REPRESENT ACTUAL TRADING. ALSO, SINCE THE TRADES HAVE NOT BEEN EXECUTED, THE RESULTS MAY HAVE UNDER-OR-OVER COMPENSATED FOR THE IMPACT, IF ANY, OF CERTAIN MARKET FACTORS, SUCH AS LACK OF LIQUIDITY. SIMULATED TRADING PROGRAMS IN GENERAL ARE ALSO SUBJECT TO THE FACT THAT THEY ARE DESIGNED WITH THE BENEFIT OF HINDSIGHT. NO REPRESENTATION IS BEING MADE THAT ANY ACCOUNT WILL OR IS LIKELY TO ACHIEVE PROFIT OR LOSSES SIMILAR TO THOSE SHOWN