
Markets
Volatility is returning to the markets as U.S. stock futures climbed 2% overnight following Wall Street’s rocky start to the second quarter. It comes ahead of this morning’s closely-watched jobless claims report, which is likely to reinforce views that the longest employment boom in U.S. history ended in March.
Source: Seeking Alpha https://seekingalpha.com/
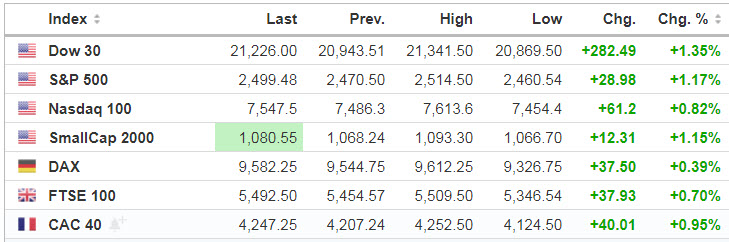
Source: https://www.investing.com/indices/indices-cfds
Economic Calendar
8:30 Initial Jobless Claims
8:30 International Trade
10:00 Factory Orders
10:30 EIA Natural Gas Inventory
4:30 PM Money Supply
4:30 PM Fed Balance Sheet
https://www.investing.com/economic-calendar/
***New: PTG Trading Room Chat Log’s Link
S&P 500
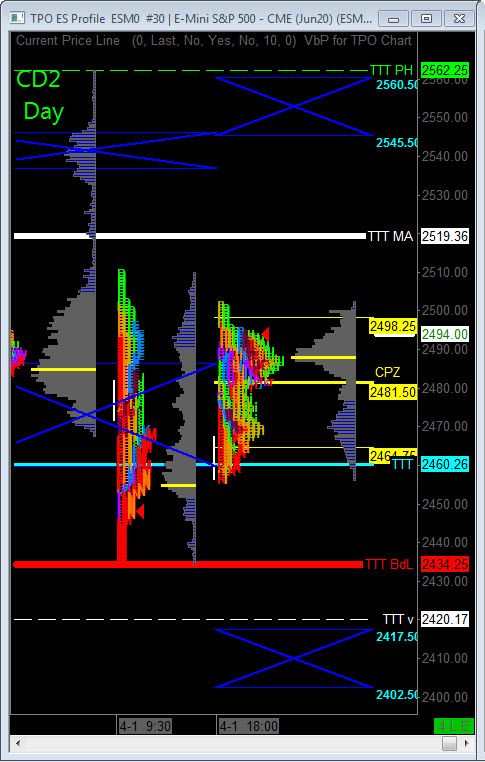
Wednesday’s Session was Cycle Day 1…Price decline which is normally expected on a CD1 did materialize, pushing price down to and slightly beyond 2452 Statistical Extreme. Cycle Day 1 Low (2434.25) is in-place.
…Transition from Cycle Day 1 to Cycle Day 2
This leads us into today’s Cycle Day 2…During GLOBEX Session price has rallied approximately 50% of target (2519.50) from the CD1 Low (2434.25). Normal for a CD2 is for some “back n fill” price action, adjusting for prior decline. Part of this process would be to re-test the CD1 Low (2434.25) for surety.
P – VA High = 2488 P – VA Low = 2452 P – POC = 2470
Bull Scenario: IF Bulls hold bid above 2475, THEN initial upside estimate targets 2500 – 2510 zone
Bear Scenario: IF Bears hold offer below 2475, THEN initial downside estimate targets 2470 – 2460 zone.
Range Projections and Key Levels (ES) June 2020 (M) Contract
HOD ATR Range Projection: 2570.00; LOD ATR Range Projection: 2388.00 3 Day Central Pivot: 2544.00; 3 Day Cycle Target: 2519.50; 10 Day Average True Range 137.00; VIX: 53
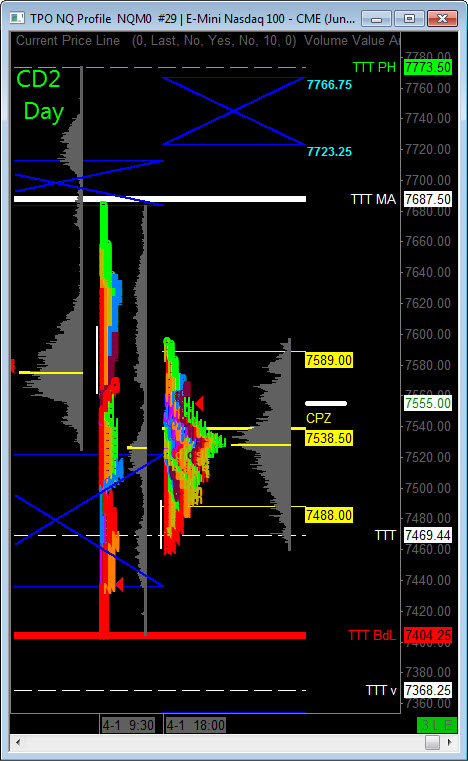
Nasdaq 100 (NQ)
Today is Cycle Day 2 (CD2)…Has rallied off CD1 Low (7404.25) and approximately 50% of expected range target of 7687.50. Normal for CD2 is for some “back n fill” price action holding above prior close (7463.50).
P – VA High = 7640 P – VA Low = 7500 P – POC = 7514
Bull Scenario: IF Bulls hold bid above 7530, THEN initial upside estimate targets 7575 – 7600 zone.
Bear Scenario: IF Bears hold offer below 7530, THEN initial downside estimate targets 7485 – 7460 zone.
Range Projections and Key Levels (NQ) June 2020 (M) Contract
HOD ATR Range Projection: 7801.00; LOD ATR Range Projection: 7255.00; 3 Day Central Pivot: 7698.00; 3 Day Cycle Target: 7688.00; 10 Day Average True Range: 400; VIX: 53
Trade Strategy: Our tactical trade strategy will simply remain unaltered…We’ll be flexible to trade both long and short side from Decision Pivot Levels. Continue to focus on Bull/Bear Stackers and Premium/Discounts. As always, remaining in alignment with dominant intra-day force increases probabilities of producing winning trades.
Stay Focused…Non-Biased…Disciplined ALWAYS USE STOPS!
Good Trading…David
“Knowing is not enough, We must APPLY. Willing is not enough, We must DO.” –Bruce Lee
*****This trade strategy report is disseminated for “education only” and should not be viewed in any way as a recommendation to buy or sell futures products.”
PAST PERFORMANCE IS NOT NECESSARILY INDICATIVE OF FUTURE RESULTS
IMPORTANT NOTICE! No representation is being made that the use of this strategy or any system or trading methodology will generate profits. Past performance is not necessarily indicative of future results. There is substantial risk of loss associated with trading securities and options on equities. Only risk capital should be used to trade. Trading securities is not suitable for everyone.
Disclaimer: Futures, Options, and Currency trading all have large potential rewards, but they also have large potential risk. You must be aware of the risks and be willing to accept them in order to invest in these markets. Don’t trade with money you can’t afford to lose.
This website is neither a solicitation nor an offer to Buy/Sell futures, options, or currencies. No representation is being made that any account will or is likely to achieve profits or losses similar to those discussed on this web site. The past performance of any trading system or methodology is not necessarily indicative of future results.
CFTC RULE 4.41 –HYPOTHETICAL OR SIMULATED PERFORMANCE RESULTS HAVE CERTAIN LIMITATIONS. UNLIKE AN ACTUAL PERFORMANCE RECORD, SIMULATED RESULTS DO NOT REPRESENT ACTUAL TRADING. ALSO, SINCE THE TRADES HAVE NOT BEEN EXECUTED, THE RESULTS MAY HAVE UNDER-OR-OVER COMPENSATED FOR THE IMPACT, IF ANY, OF CERTAIN MARKET FACTORS, SUCH AS LACK OF LIQUIDITY. SIMULATED TRADING PROGRAMS IN GENERAL ARE ALSO SUBJECT TO THE FACT THAT THEY ARE DESIGNED WITH THE BENEFIT OF HINDSIGHT. NO REPRESENTATION IS BEING MADE THAT ANY ACCOUNT WILL OR IS LIKELY TO ACHIEVE PROFIT OR LOSSES SIMILAR TO THOSE SHOWN