
Markets
Stocks closed higher on Wednesday following two days of declines, though futures hugged the flatline for much of the overnight session. Traders are meanwhile looking out for more economic data that could give another snapshot of the ongoing recovery. Small caps are also in focus given the strength seen yesterday, with the Russell 2000 ending the session up 2.4% to log its best day since March 1.

Source: SeekingAlpha.com
Economic Calendar
8:30 Initial Jobless Claims
8:30 Chicago Fed National Activity Index
10:00 Existing Home Sales
10:00 Leading Indicators
10:30 EIA Natural Gas Inventory
11:00 Kansas City Fed Mfg Survey
4:30 PM Fed Balance Sheet
https://www.investing.com/economic-calendar/
***New: PTG Trading Room Chat Log’s Link
S&P 500

Tuesday’s Session was Cycle Day 3 (CD3): Price completed this positive cycle by recovering and closing back above CD1 Low (4141.75). Range was 54.25 handles on 1.476M contracts exchanged.
…Transition from Cycle Day 3 to Cycle Day 1
This leads us into Cycle Day 1 (CD1): Normal for CD1 is a decline measuring an average of 4114. As such estimated scenarios to consider for today’s trading.
1.) Price sustains a bid above 4153, initially targets 4167 – 4170 zone.
2.) Price sustains an offer below 4153, initially targets 4145– 4140 zone.
*****3 Day Cycle has a 91% probability of fulfilling Positive Cycle Statistic covering 12 years of recorded tracking history.
PVA High Edge = 4164 PVA Low Edge = 4131 Prior POC = 4153
Range Projections and Key Levels (ES) June 2021 (M) Contract
HOD ATR Range Projection: 4186; LOD ATR Range Projection: 4134; 3 Day Central Pivot: 4145; 3 Day Cycle Target: 4187; 10 Day Average True Range 33; VIX: 17

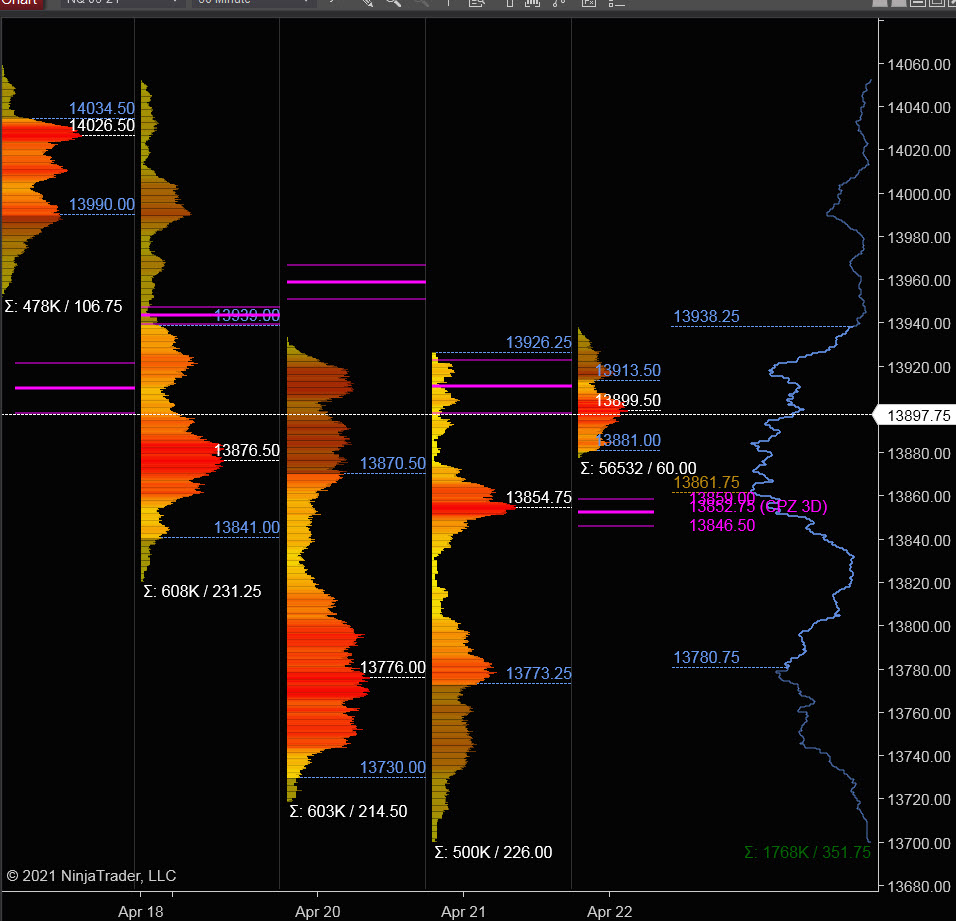
Nasdaq 100 (NQ)

Today is Cycle Day 1 (CD1)…Expectation for this cycle day is a decline with average measuring 13848. Prior range was 214 handles on 603k contracts exchanged. As such, there are two estimated scenarios to consider for today’s trading.
PVA High Edge = 13926 PVA Low Edge = 13773 Prior POC = 13855
Bull Scenario: IF Bulls sustain a bid above 13875, THEN initial upside estimate targets 13938 – 13955 zone.
Bear Scenario: IF Bears sustain an offer below 13875, THEN initial downside estimate targets 13855 – 13841 zone.
Range Projections and Key Levels (NQ) June 2021 (M) Contract
HOD ATR Range Projection: 14056; LOD ATR Range Projection: 13759; 3 Day Central Pivot: 13853; 3 Day Cycle Target: 14227; 10 Day Average True Range: 178; VIX: 17
Trade Strategy: Our tactical trade strategy will simply remain unaltered…We’ll be flexible to trade both long and short side from Decision Pivot Levels. Continue to focus on Bull/Bear Stackers and Premium/Discounts. As always, remaining in alignment with dominant intra-day force increases probabilities of producing winning trades.
Stay Focused…Non-Biased…Disciplined ALWAYS USE STOPS!
Good Trading…David
“Knowing is not enough, We must APPLY. Willing is not enough, We must DO.” –Bruce Lee
*****This trade strategy report is disseminated for “education only” and should not be viewed in any way as a recommendation to buy or sell futures products.”
PAST PERFORMANCE IS NOT NECESSARILY INDICATIVE OF FUTURE RESULTS
IMPORTANT NOTICE! No representation is being made that the use of this strategy or any system or trading methodology will generate profits. Past performance is not necessarily indicative of future results. There is substantial risk of loss associated with trading securities and options on equities. Only risk capital should be used to trade. Trading securities is not suitable for everyone.
Disclaimer: Futures, Options, and Currency trading all have large potential rewards, but they also have large potential risk. You must be aware of the risks and be willing to accept them in order to invest in these markets. Don’t trade with money you can’t afford to lose.
This website is neither a solicitation nor an offer to Buy/Sell futures, options, or currencies. No representation is being made that any account will or is likely to achieve profits or losses similar to those discussed on this web site. The past performance of any trading system or methodology is not necessarily indicative of future results.
CFTC RULE 4.41 –HYPOTHETICAL OR SIMULATED PERFORMANCE RESULTS HAVE CERTAIN LIMITATIONS. UNLIKE AN ACTUAL PERFORMANCE RECORD, SIMULATED RESULTS DO NOT REPRESENT ACTUAL TRADING. ALSO, SINCE THE TRADES HAVE NOT BEEN EXECUTED, THE RESULTS MAY HAVE UNDER-OR-OVER COMPENSATED FOR THE IMPACT, IF ANY, OF CERTAIN MARKET FACTORS, SUCH AS LACK OF LIQUIDITY. SIMULATED TRADING PROGRAMS IN GENERAL ARE ALSO SUBJECT TO THE FACT THAT THEY ARE DESIGNED WITH THE BENEFIT OF HINDSIGHT. NO REPRESENTATION IS BEING MADE THAT ANY ACCOUNT WILL OR IS LIKELY TO ACHIEVE PROFIT OR LOSSES SIMILAR TO THOSE SHOWN