
Markets
U.S. stock index futures are ahead by 0.5%, with President Trump scheduled to pass the follow-on bill for the CARES Act and 16 states unveiling plans to lift coronavirus restrictions.
Source: Seeking Alpha https://seekingalpha.com/
Stock futures are positive by 0.50% during overnight trade action
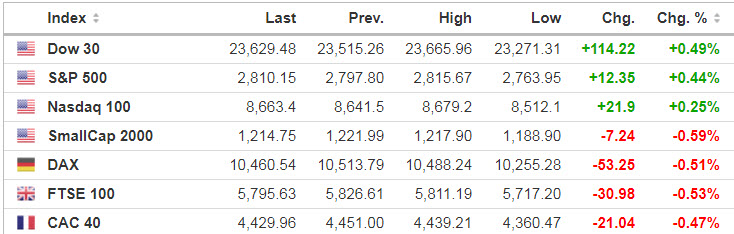
Source: https://www.investing.com/indices/indices-cfds
Economic Calendar
8:30 Durable Goods
10:00 Consumer Sentiment
1:00 PM Baker-Hughes Rig Count
https://www.investing.com/economic-calendar/
***New: PTG Trading Room Chat Log’s Link
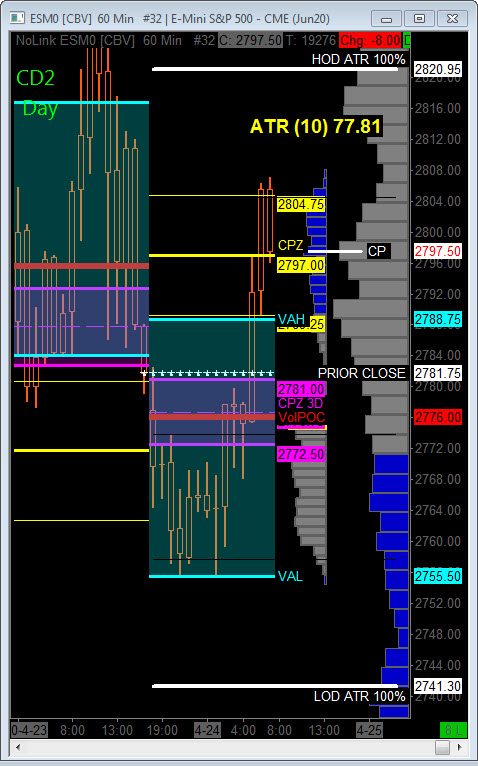
S&P 500
Prior Session was Cycle Day 1…Early strength was rejected within CD1 Penetration Zone as price reversed closing near session low.
…Transition from Cycle Day 1 to Cycle Day 2
This leads us into today’s Cycle Day 2…Selling momentum from prior session continued into overnight trade as price violated CD1 Low (2772.75) and found responsive buyers at CD2 Violation Level (2758.50).
Price has fulfilled the historical 3-day average rally of 30.25 handles (2803).
Today we’ll mark as a “wild-card” day as CD2 “normal” expected rotational price action with end of week position squaring.
P – VA High = 2817 P – VA Low = 2784 P – POC = 2795
Bull Scenario: IF Bulls hold bid above 2795, THEN initial upside estimate targets 2804 – 2817 zone
Bear Scenario: IF Bears hold offer below 2795, THEN initial downside estimate targets 2782 – 2772 zone.
Range Projections and Key Levels (ES) June 2020 (M) Contract
HOD ATR Range Projection: 2821; LOD ATR Range Projection: 2741 3 Day Central Pivot: 2777; 3 Day Cycle Target: 2803; 10 Day Average True Range 78; VIX: 39
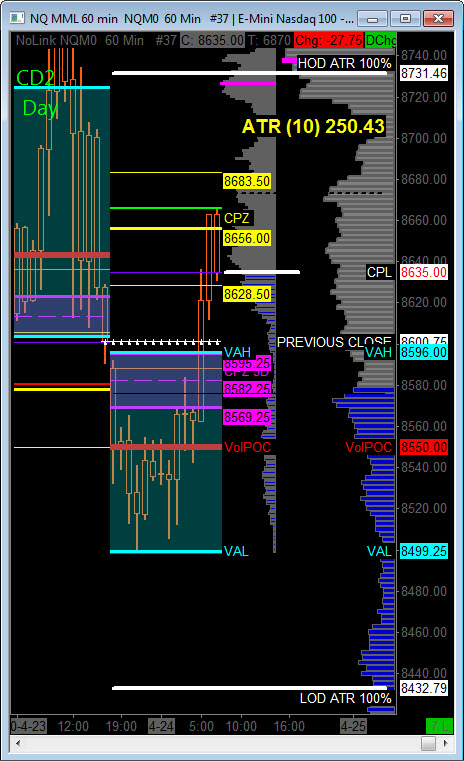
Nasdaq 100 (NQ)
Today is Cycle Day 2 (CD2)…Price has rallied off overnight lows fulfilling 3-day average rally (8659). Expectation is for a CD2 “normal” range type trade to balance-off recent swings.
P – VA High = 8724 P – VA Low = 8604 P – POC = 8644
Bull Scenario: IF Bulls hold bid above 8644, THEN initial upside estimate targets 8660 – 8684 zone.
Bear Scenario: IF Bears hold offer below 8644, THEN initial downside estimate targets 8630 – 8600 zone.
Range Projections and Key Levels (NQ) June 2020 (M) Contract
HOD ATR Range Projection: 8732; LOD ATR Range Projection: 8433; 3 Day Central Pivot: 8682; 3 Day Cycle Target: 8659; 10 Day Average True Range: 250; VIX: 39
Trade Strategy: Our tactical trade strategy will simply remain unaltered…We’ll be flexible to trade both long and short side from Decision Pivot Levels. Continue to focus on Bull/Bear Stackers and Premium/Discounts. As always, remaining in alignment with dominant intra-day force increases probabilities of producing winning trades.
Stay Focused…Non-Biased…Disciplined ALWAYS USE STOPS!
Good Trading…David
“Knowing is not enough, We must APPLY. Willing is not enough, We must DO.” –Bruce Lee
*****This trade strategy report is disseminated for “education only” and should not be viewed in any way as a recommendation to buy or sell futures products.”
PAST PERFORMANCE IS NOT NECESSARILY INDICATIVE OF FUTURE RESULTS
IMPORTANT NOTICE! No representation is being made that the use of this strategy or any system or trading methodology will generate profits. Past performance is not necessarily indicative of future results. There is substantial risk of loss associated with trading securities and options on equities. Only risk capital should be used to trade. Trading securities is not suitable for everyone.
Disclaimer: Futures, Options, and Currency trading all have large potential rewards, but they also have large potential risk. You must be aware of the risks and be willing to accept them in order to invest in these markets. Don’t trade with money you can’t afford to lose.
This website is neither a solicitation nor an offer to Buy/Sell futures, options, or currencies. No representation is being made that any account will or is likely to achieve profits or losses similar to those discussed on this web site. The past performance of any trading system or methodology is not necessarily indicative of future results.
CFTC RULE 4.41 –HYPOTHETICAL OR SIMULATED PERFORMANCE RESULTS HAVE CERTAIN LIMITATIONS. UNLIKE AN ACTUAL PERFORMANCE RECORD, SIMULATED RESULTS DO NOT REPRESENT ACTUAL TRADING. ALSO, SINCE THE TRADES HAVE NOT BEEN EXECUTED, THE RESULTS MAY HAVE UNDER-OR-OVER COMPENSATED FOR THE IMPACT, IF ANY, OF CERTAIN MARKET FACTORS, SUCH AS LACK OF LIQUIDITY. SIMULATED TRADING PROGRAMS IN GENERAL ARE ALSO SUBJECT TO THE FACT THAT THEY ARE DESIGNED WITH THE BENEFIT OF HINDSIGHT. NO REPRESENTATION IS BEING MADE THAT ANY ACCOUNT WILL OR IS LIKELY TO ACHIEVE PROFIT OR LOSSES SIMILAR TO THOSE SHOWN