
Markets
U.S. stock index futures are pointing to losses of 0.2% as investors take stock of last week’s rally. Analysts have warned that the upcoming earnings season could be the first quarter of contracting corporate results since 2016, with U.S. banks set to get the ball rolling later this week. Meanwhile, oil prices continue to advance, with Brent and WTI hitting fresh 2019 highs overnight ($70.62/bbl and 63.45/bbl, respectively) amid an escalation of violence in Libya, OPEC’s ongoing supply cuts, and U.S. sanctions against Iran and Venezuela.
In Asia, Japan -0.2%. Hong Kong +0.5%. China -0.1%. India -0.4%.
In Europe, at midday, London +0.1%. Paris +0.1%. Frankfurt -0.3%.
Futures at 6:20, Dow -0.2%. S&P -0.2%. Nasdaq -0.2%. Crude +0.6% to $63.45. Gold +0.4% to $1301.10 Bitcoin +1.7% to $5238.
Ten-year Treasury Yield unchanged at 2.5%
Source: Seeking Alpha
Economic Calendar
10:00Factory Orders
12:30 PMTD Ameritrade IMX
***PTG Trading Room Chat Log’s Link
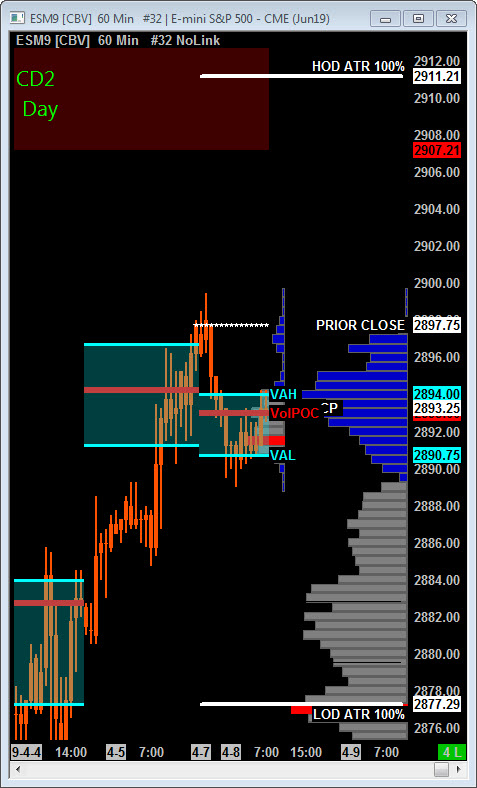
S&P 500
Today is Cycle Day 2 (CD2)…Price is quietly consolidating prior session’s gains within value. Key Support remains marked at the 2890 handle. Further upside targets 2908.50 3 Day Rally Objective.
CD2 Range High = 2913.00 CD2 Range Low = 2880.50 CD2 Range Avg = 33.00
Scenario 1: IF Bulls hold bid above 2898, THEN initial upside potential targets 2905 – 2908.50 3 Day Cycle Penetration Zone.
Scenario 2: IF Bears hold offer below 2898, THEN initial downside objective targets 2890 handle…Further violation targets 2885 – 2880 3 Day Central Pivot Zone.
Range Projections and Key Levels (ES) June 2019 (M) Contract
HOD ATR Range Projection: 2911.25; LOD ATR Range Projection: 2877.25; 3 Day Central Pivot: 2883.25; 3 Day Cycle Target: 2908.50; 10 Day Average True Range 22.25; VIX: 13.50
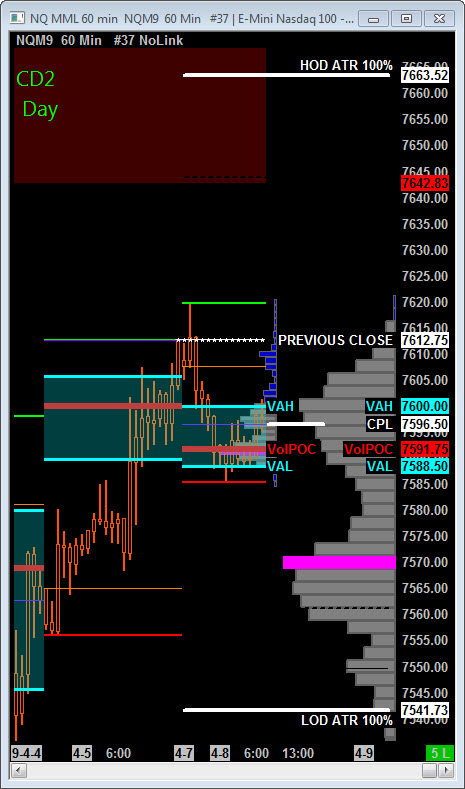
Nasdaq 100 (NQ)
Today is Cycle Day 2 (CD2)…Price is quietly consolidating prior session’s gains within value. Key Support remains marked at the 2890 handle. Further upside targets 7636.50 3 Day Rally Objective.
CD2 Range High = 7642.00 CD2 Range Low = 7563.00 CD2 Range Avg = 56.50
Scenario 1: IF Bulls hold bid above 7613, THEN initial upside potential targets 7625.50 – 7636.50 CD2 Penetration Zone.
Scenario 2: IF Bears hold offer below 7613, THEN initial downside objective targets 7580.25 – 7570 3 Day Central Pivot Zone.
Range Projections and Key Levels (NQ) June 2019 (M) Contract
HOD ATR Range Projection: 7663.50; LOD ATR Range Projection: 7541.75; 3 Day Central Pivot: 7575.00; 3 Day Cycle Target: 7636.50; 10 Day Average True Range: 78.00; VIX: 13.50
Trade Strategy: Our tactical trade strategy will simply remain unaltered…We’ll be flexible to trade both long and short side from Decision Pivot Levels. Continue to focus on Bull/Bear Stackers and Premium/Discounts. As always, remaining in alignment with dominant intra-day force increases probabilities of producing winning trades.
Stay Focused…Non-Biased…Disciplined ALWAYS USE STOPS!
Good Trading…David
“Knowing is not enough, We must APPLY. Willing is not enough, We must DO.” –Bruce Lee
*****This trade strategy report is disseminated for “education only” and should not be viewed in any way as a recommendation to buy or sell futures products.”
PAST PERFORMANCE IS NOT NECESSARILY INDICATIVE OF FUTURE RESULTS
IMPORTANT NOTICE! No representation is being made that the use of this strategy or any system or trading methodology will generate profits. Past performance is not necessarily indicative of future results. There is substantial risk of loss associated with trading securities and options on equities. Only risk capital should be used to trade. Trading securities is not suitable for everyone.
Disclaimer: Futures, Options, and Currency trading all have large potential rewards, but they also have large potential risk. You must be aware of the risks and be willing to accept them in order to invest in these markets. Don’t trade with money you can’t afford to lose.
This website is neither a solicitation nor an offer to Buy/Sell futures, options, or currencies. No representation is being made that any account will or is likely to achieve profits or losses similar to those discussed on this web site. The past performance of any trading system or methodology is not necessarily indicative of future results.
CFTC RULE 4.41 –HYPOTHETICAL OR SIMULATED PERFORMANCE RESULTS HAVE CERTAIN LIMITATIONS. UNLIKE AN ACTUAL PERFORMANCE RECORD, SIMULATED RESULTS DO NOT REPRESENT ACTUAL TRADING. ALSO, SINCE THE TRADES HAVE NOT BEEN EXECUTED, THE RESULTS MAY HAVE UNDER-OR-OVER COMPENSATED FOR THE IMPACT, IF ANY, OF CERTAIN MARKET FACTORS, SUCH AS LACK OF LIQUIDITY. SIMULATED TRADING PROGRAMS IN GENERAL ARE ALSO SUBJECT TO THE FACT THAT THEY ARE DESIGNED WITH THE BENEFIT OF HINDSIGHT. NO REPRESENTATION IS BEING MADE THAT ANY ACCOUNT WILL OR IS LIKELY TO ACHIEVE PROFIT OR LOSSES SIMILAR TO THOSE SHOWN