
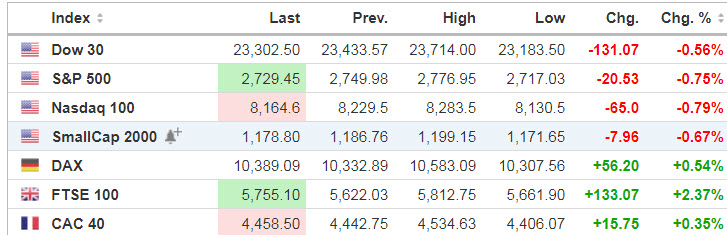
Markets
Global stocks continue to gain on hopes that the pandemic is nearing a peak and that a crude oil output deal will be struck. In Asia, the Shanghai Composite Index rose 0.4%, Hong Kong’s Hang Seng Index was up 1.4%, South Korea’s Kospi gained 1.6% and Australia’s ASX rallied 3.5%.
U.S. stock futures are in negative territory pre-RTH

Things are pretty tense in the oil markets ahead of a virtual meeting of the alliance of OPEC and non-OPEC producers today at 4:00 p.m. Vienna time (10 a.m. ET). The spotlight will be on whether Russia, Saudi Arabia and non-participant U.S. will agree to cut crude production amid plunging prices and a lack of storage capacity.
Source: Seeking Alpha https://seekingalpha.com/
Economic Calendar https://www.investing.com/economic-calendar/
The Department of Labor is due to report jobless claims for the week ending April 4. The report follows on the heels of the last two weeks that saw almost 10M Americans file for unemployment benefits. For this week’s report, economists expect on average about 5.2M claims to have been filed, with JPMorgan at the high end with a forecast for 7M filings.
8:30 Initial Jobless Claims
8:30 Producer Price Index
10:00 Jerome Powell Speech
10:00 Consumer Sentiment
10:00 Wholesale Trade
10:30 EIA Natural Gas Inventory
4:30 PM Money Supply
4:30 PM Fed Balance Sheet
We’ll keep the “High Surf Warning” posted for the foreseeable future.

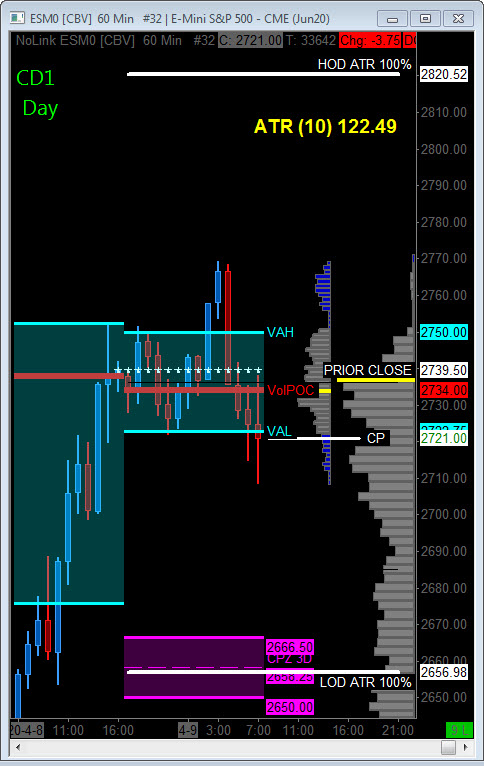
S&P 500
Wednesday’s Session was Cycle Day 3 (CD3): This day is the official “end of the cycle” as Positive 3 Day Cycle Statistic was fulfilled. During CD3 price held above CD2 low (2620.75), rallied throughout session testing CD2 high and closing 2739.50.
…Transition from Cycle Day 3 to Cycle Day 1
This leads us into Cycle Day 1 (CD1): Objective for this cycle day is to “probe for a new secure low” from which to begin the next cycle’s rally.
Price has pushed above CD3 High (2752.50) pre-RTH reaching initial CD1 Penetration Level (2762.50) where it was rejected. Currently price is trading below prior close (2739.50) and below developing Value Zone.
IF CD1 unfolds as “normal” as outlined above, THEN Average Decline objective measures 2642 – 2640 zone.
P-VA High = 2752 P-VA Low = 2675 P-POC = 2738
Bull Scenario: IF Bulls hold bid above 2740, THEN initial upside estimate targets 2762 – 2782 zone
Bear Scenario: IF Bears hold offer below 2740, THEN initial downside estimate targets 2700 – 2690 zone.
Range Projections and Key Levels (ES) June 2020 (M) Contract
HOD ATR Range Projection: 2820; LOD ATR Range Projection: 2657; 3 Day Central Pivot: 2658; 3 Day Cycle Target: 2814; 10 Day Average True Range 122; VIX: 45.00
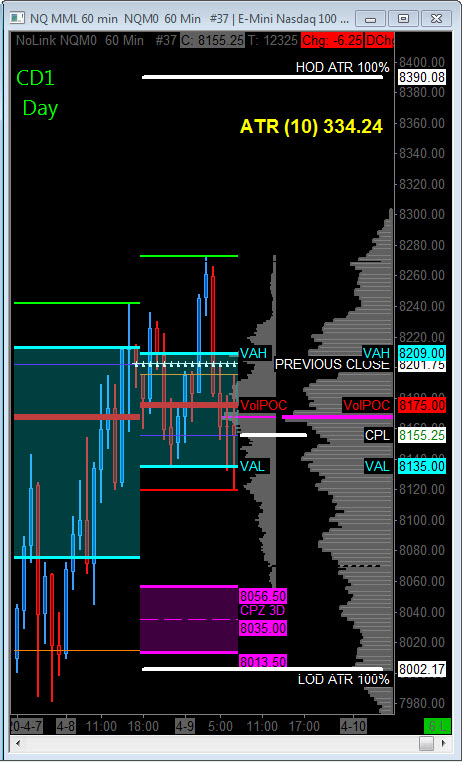
Nasdaq 100 (NQ)
Today is Cycle Day 1 (CD1)…Price fulfilled Penetration Level (8266) and was rejected during pre-RTH trading. Currently price is blow prior close (8201.75) and below developing Value Zone. Average Decline for CD1 measures 7919.
P-VA High = 8212 P-VA Low = 8075 P-POC = 8166
Bull Scenario: IF Bulls hold bid above 8170, THEN initial upside estimate targets 8242 – 8266 zone.
Bear Scenario: IF Bears hold offer below 8170, THEN initial downside estimate targets 8120 – 8075 zone.
Range Projections and Key Levels (NQ) June 2020 (M) Contract
HOD ATR Range Projection: 8.90; LOD ATR Range Projection: 8002; 3 Day Central Pivot: 8035; 3 Day Cycle Target: 8197; 10 Day Average True Range: 334; VIX: 45
Trade Strategy: Our tactical trade strategy will simply remain unaltered…We’ll be flexible to trade both long and short side from Decision Pivot Levels. Continue to focus on Bull/Bear Stackers and Premium/Discounts. As always, remaining in alignment with dominant intra-day force increases probabilities of producing winning trades.
Stay Focused…Non-Biased…Disciplined ALWAYS USE STOPS!
Good Trading…David
“Knowing is not enough, We must APPLY. Willing is not enough, We must DO.” –Bruce Lee
*****This trade strategy report is disseminated for “education only” and should not be viewed in any way as a recommendation to buy or sell futures products.”
PAST PERFORMANCE IS NOT NECESSARILY INDICATIVE OF FUTURE RESULTS
IMPORTANT NOTICE! No representation is being made that the use of this strategy or any system or trading methodology will generate profits. Past performance is not necessarily indicative of future results. There is substantial risk of loss associated with trading securities and options on equities. Only risk capital should be used to trade. Trading securities is not suitable for everyone.
Disclaimer: Futures, Options, and Currency trading all have large potential rewards, but they also have large potential risk. You must be aware of the risks and be willing to accept them in order to invest in these markets. Don’t trade with money you can’t afford to lose.
This website is neither a solicitation nor an offer to Buy/Sell futures, options, or currencies. No representation is being made that any account will or is likely to achieve profits or losses similar to those discussed on this web site. The past performance of any trading system or methodology is not necessarily indicative of future results.
CFTC RULE 4.41 –HYPOTHETICAL OR SIMULATED PERFORMANCE RESULTS HAVE CERTAIN LIMITATIONS. UNLIKE AN ACTUAL PERFORMANCE RECORD, SIMULATED RESULTS DO NOT REPRESENT ACTUAL TRADING. ALSO, SINCE THE TRADES HAVE NOT BEEN EXECUTED, THE RESULTS MAY HAVE UNDER-OR-OVER COMPENSATED FOR THE IMPACT, IF ANY, OF CERTAIN MARKET FACTORS, SUCH AS LACK OF LIQUIDITY. SIMULATED TRADING PROGRAMS IN GENERAL ARE ALSO SUBJECT TO THE FACT THAT THEY ARE DESIGNED WITH THE BENEFIT OF HINDSIGHT. NO REPRESENTATION IS BEING MADE THAT ANY ACCOUNT WILL OR IS LIKELY TO ACHIEVE PROFIT OR LOSSES SIMILAR TO THOSE SHOWN