
Markets
Optimism over the economy’s reopening appears to be supporting stock prices and the oil rally, as S&P 500 futures rose another 1% overnight and crude topped $25/bbl.
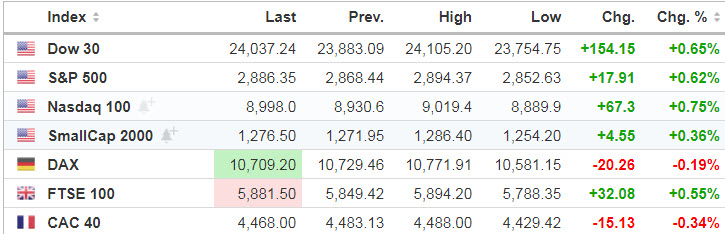
U.S. stock index futures are trading higher .05% – 1.0% during GLOBEX
Source: Seeking Alpha https://seekingalpha.com/

Economic Calendar https://www.investing.com/economic-calendar/
8:15 ADP Jobs Report
8:30 Treasury Refunding Quarterly Announcement
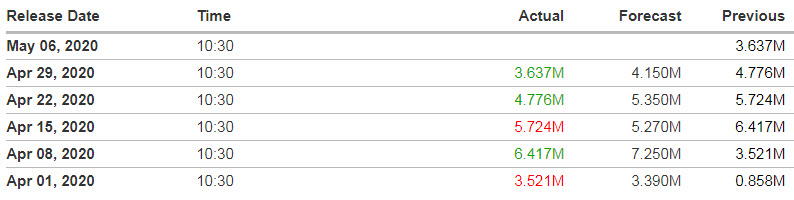
10:30 EIA Petroleum Inventories
1:30 PM Fed’s Bostic: “Federal Reserve’s Response to COVID-19”
S&P 500
Prior Session was Cycle Day 3 (CD3): Price rallied fulfilling 3 Day Cycle Objectives and extended to Penetration Levels before reversing direction late in the day closing near session low.
…Transition from Cycle Day 3 to Cycle Day 1
This leads us into Cycle Day 1 (CD1): Having closed low within the range, momentum may take price lower to probe for a “secure-low” before the next rally can begin. Previous two sessions have seen strong buying which may not dissipate so easily.
Our Line-in-the-Sand has been 2850 recently, so we’ll keep it there for today’s session. IF price violates and converts to lower resistance, THEN lower target / buy zone is measured between 2830 – 2825. CD1 Average Decline measures 2766.25.
P-VA High = 2889 P-VA Low = 2860 P-POC = 2884
Bull Scenario: IF Bulls hold bid above 2850, THEN initial upside estimate targets 2880 – 2890 zone
Bear Scenario: IF Bears hold offer below 2850, THEN initial downside estimate targets 2830 – 2825 zone.
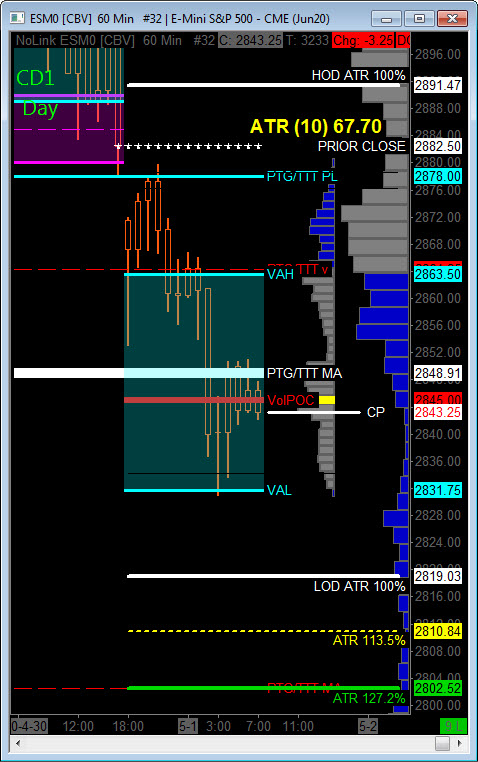
Range Projections and Key Levels (ES) June 2020 (M) Contract
HOD ATR Range Projection: 2903; LOD ATR Range Projection: 2826; 3 Day Central Pivot: 2835; 3 Day Cycle Target: 2874; 10 Day Average True Range 66; VIX: 32.25
Nasdaq 100 (NQ)
Today is Cycle Day 1 (CD1)…Shallow decline to secure low during overnight trade has lead to sharp rally higher testing prior high range levels near 9000 – 9010. Price has recover 3 Day Central Pivot Zone as bulls remain in-control.
P-VA High = 9000 P-VA Low = 8900 P-POC = 8950
Bull Scenario: IF Bulls hold bid above 8950, THEN initial upside estimate targets 9000 – 9020 zone.
Bear Scenario: IF Bears hold offer below 8950, THEN initial downside estimate targets 8920 – 8900 zone.
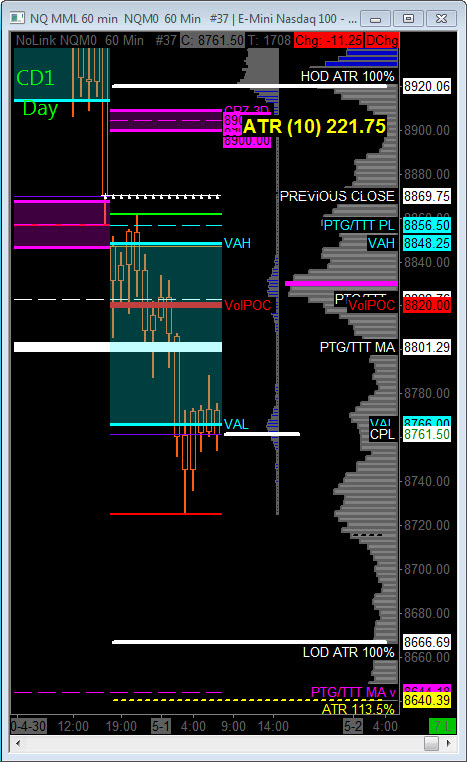
Range Projections and Key Levels (NQ) June 2020 (M) Contract
HOD ATR Range Projection: 9087; LOD ATR Range Projection: 8800; 3 Day Central Pivot: 8800; 3 Day Cycle Target: 8955; 10 Day Average True Range: 223; VIX: 32.25
Trade Strategy: Our tactical trade strategy will simply remain unaltered…We’ll be flexible to trade both long and short side from Decision Pivot Levels. Continue to focus on Bull/Bear Stackers and Premium/Discounts. As always, remaining in alignment with dominant intra-day force increases probabilities of producing winning trades.
Stay Focused…Non-Biased…Disciplined ALWAYS USE STOPS!
Good Trading…David
“Knowing is not enough, We must APPLY. Willing is not enough, We must DO.” –Bruce Lee
*****This trade strategy report is disseminated for “education only” and should not be viewed in any way as a recommendation to buy or sell futures products.”
PAST PERFORMANCE IS NOT NECESSARILY INDICATIVE OF FUTURE RESULTS
IMPORTANT NOTICE! No representation is being made that the use of this strategy or any system or trading methodology will generate profits. Past performance is not necessarily indicative of future results. There is substantial risk of loss associated with trading securities and options on equities. Only risk capital should be used to trade. Trading securities is not suitable for everyone.
Disclaimer: Futures, Options, and Currency trading all have large potential rewards, but they also have large potential risk. You must be aware of the risks and be willing to accept them in order to invest in these markets. Don’t trade with money you can’t afford to lose.
This website is neither a solicitation nor an offer to Buy/Sell futures, options, or currencies. No representation is being made that any account will or is likely to achieve profits or losses similar to those discussed on this web site. The past performance of any trading system or methodology is not necessarily indicative of future results.
CFTC RULE 4.41 –HYPOTHETICAL OR SIMULATED PERFORMANCE RESULTS HAVE CERTAIN LIMITATIONS. UNLIKE AN ACTUAL PERFORMANCE RECORD, SIMULATED RESULTS DO NOT REPRESENT ACTUAL TRADING. ALSO, SINCE THE TRADES HAVE NOT BEEN EXECUTED, THE RESULTS MAY HAVE UNDER-OR-OVER COMPENSATED FOR THE IMPACT, IF ANY, OF CERTAIN MARKET FACTORS, SUCH AS LACK OF LIQUIDITY. SIMULATED TRADING PROGRAMS IN GENERAL ARE ALSO SUBJECT TO THE FACT THAT THEY ARE DESIGNED WITH THE BENEFIT OF HINDSIGHT. NO REPRESENTATION IS BEING MADE THAT ANY ACCOUNT WILL OR IS LIKELY TO ACHIEVE PROFIT OR LOSSES SIMILAR TO THOSE SHOWN