
Markets
Removing a chunk of trade uncertainty that had been hanging over the market, top U.S. and Chinese officials have agreed to strengthen cooperation for a phase one trade deal (see more below). U.S. stock index futures rose another 1% on the news, building on a strong week that saw the Nasdaq Composite yesterday reenter positive territory for 2020.
Source: SeekingAlpha.com
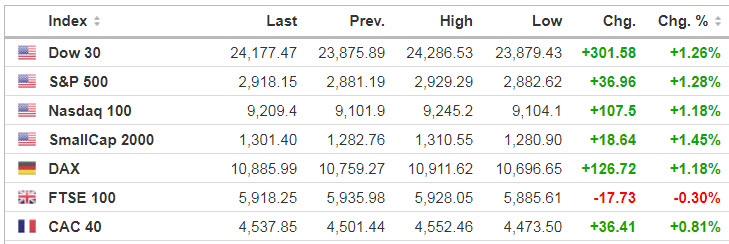
Source: https://www.investing.com/indices/indices-cfds
Economic Calendar
8:30 Non-farm payrolls
10:00 Wholesale Trade
1:00 PM Baker-Hughes Rig Count
https://www.investing.com/economic-calendar/

The April non-farm payrolls report is expected to show that a record 22M jobs were lost as the U.S. shut down to stop the spread of the coronavirus, driving the unemployment rate to 16%.
Source: SeekingAlpha.com
***New: PTG Trading Room Chat Log’s Link
S&P 500
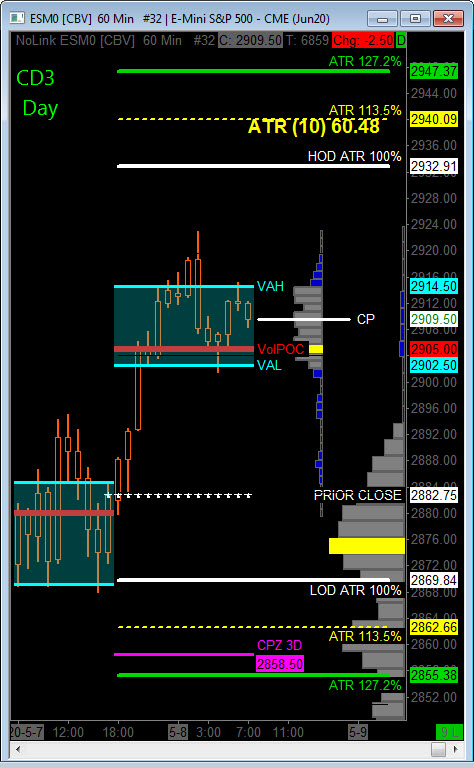
Prior Session was Cycle Day 2 (CD2): Typical of CD2, price consolidated throughout the session with a strong underlying bid structure and closed high in it’s range.
…Transition from Cycle Day 2 to Cycle Day 3
This leads us into Cycle Day 3 (CD3): Price has continued to rally during Globex Session fulfilling Positive Cycle Statistics and CD3 Penetration Zone. Recovery of 3 Day Central Pivot Zones keep bulls in full dominant control.
*****3 Day Cycle has a 91% probability of fulfilling Positive Statistic covering 12 years of recorded tracking history.
PVA High Edge = 2885 PVA Low Edge = 2869 Prior POC = 2880
Bull Scenario: IF Bulls hold bid above 2895, THEN initial upside estimate targets 2905 – 2915 zone.
Bear Scenario: IF Bears hold offer below 2895, THEN initial downside estimate targets 2885 – 2875 zone.
Range Projections and Key Levels (ES) June 2020 (M) Contract
HOD ATR Range Projection: 2933; LOD ATR Range Projection: 2870; 3 Day Central Pivot: 2858; 3 Day Cycle Target: 2960; 10 Day Average True Range 60.50; VIX: 30.00
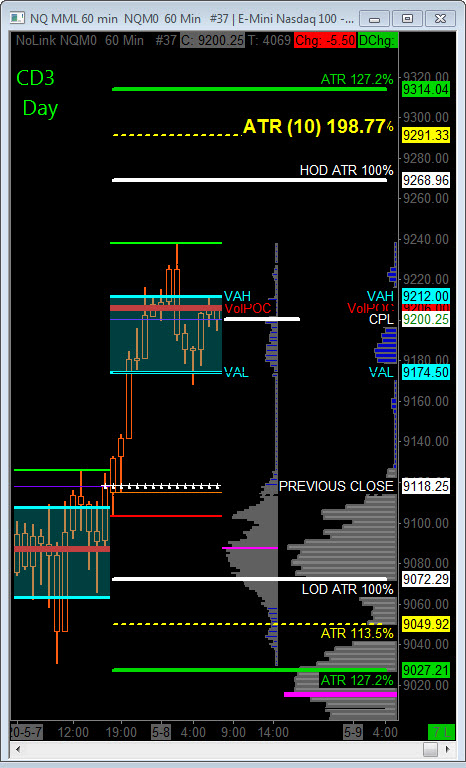
Nasdaq 100 (NQ)
Today is Cycle Day 3 (CD3)…Price has fulfilled Positive 3 Day Cycle Statistic.
PVA High Edge = 9107 PVA Low Edge = 9063 Prior POC = 9087
Bull Scenario: IF Bulls hold bid above 9170, THEN initial upside estimate targets 9205 – 9215 zone.
Bear Scenario: IF Bears hold offer below 9170, THEN initial downside estimate targets 9150 – 9125 zone.
Range Projections and Key Levels (NQ) June 2020 (M) Contract
HOD ATR Range Projection: 9269; LOD ATR Range Projection: 9072; 3 Day Central Pivot: 8978; 3 Day Cycle Target: 9253; 10 Day Average True Range: 199; VIX: 30.00
Trade Strategy: Our tactical trade strategy will simply remain unaltered…We’ll be flexible to trade both long and short side from Decision Pivot Levels. Continue to focus on Bull/Bear Stackers and Premium/Discounts. As always, remaining in alignment with dominant intra-day force increases probabilities of producing winning trades.
Stay Focused…Non-Biased…Disciplined ALWAYS USE STOPS!
Good Trading…David
“Knowing is not enough, We must APPLY. Willing is not enough, We must DO.” –Bruce Lee
*****This trade strategy report is disseminated for “education only” and should not be viewed in any way as a recommendation to buy or sell futures products.”
PAST PERFORMANCE IS NOT NECESSARILY INDICATIVE OF FUTURE RESULTS
IMPORTANT NOTICE! No representation is being made that the use of this strategy or any system or trading methodology will generate profits. Past performance is not necessarily indicative of future results. There is substantial risk of loss associated with trading securities and options on equities. Only risk capital should be used to trade. Trading securities is not suitable for everyone.
Disclaimer: Futures, Options, and Currency trading all have large potential rewards, but they also have large potential risk. You must be aware of the risks and be willing to accept them in order to invest in these markets. Don’t trade with money you can’t afford to lose.
This website is neither a solicitation nor an offer to Buy/Sell futures, options, or currencies. No representation is being made that any account will or is likely to achieve profits or losses similar to those discussed on this web site. The past performance of any trading system or methodology is not necessarily indicative of future results.
CFTC RULE 4.41 –HYPOTHETICAL OR SIMULATED PERFORMANCE RESULTS HAVE CERTAIN LIMITATIONS. UNLIKE AN ACTUAL PERFORMANCE RECORD, SIMULATED RESULTS DO NOT REPRESENT ACTUAL TRADING. ALSO, SINCE THE TRADES HAVE NOT BEEN EXECUTED, THE RESULTS MAY HAVE UNDER-OR-OVER COMPENSATED FOR THE IMPACT, IF ANY, OF CERTAIN MARKET FACTORS, SUCH AS LACK OF LIQUIDITY. SIMULATED TRADING PROGRAMS IN GENERAL ARE ALSO SUBJECT TO THE FACT THAT THEY ARE DESIGNED WITH THE BENEFIT OF HINDSIGHT. NO REPRESENTATION IS BEING MADE THAT ANY ACCOUNT WILL OR IS LIKELY TO ACHIEVE PROFIT OR LOSSES SIMILAR TO THOSE SHOWN