
Markets
Equities appear to be starting on a tepid note, with futures largely unchanged for most of the night. Later in today’s session we’ll get minutes of the FOMC’s most recent monetary policy meeting, when the central bank signaled plans to keep rates close to zero for years.
Source: Seeking Alpha https://seekingalpha.com/
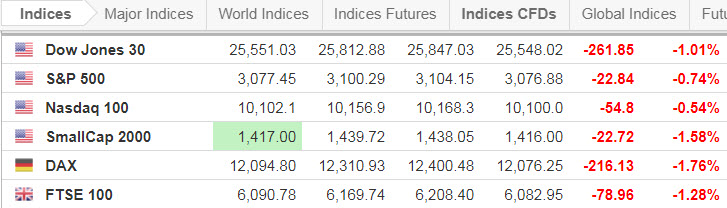
Source: https://www.investing.com/indices/indices-cfds
Economic Calendar
8:15 ADP Jobs Report
9:45 PMI Manufacturing Index
10:00 ISM Manufacturing Index
10:00 Construction Spending
10:30 EIA Petroleum Inventories
2:00 PM FOMC minutes
Source: https://www.investing.com/economic-calendar/

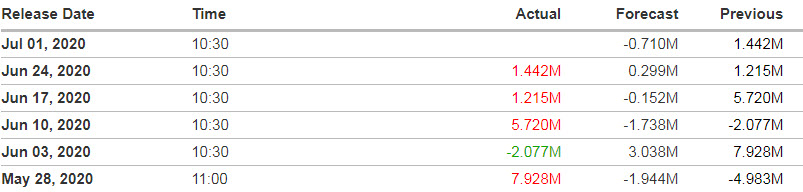
Source: https://www.investing.com/economic-calendar/eia-crude-oil-inventories-75
S&P 500 (ES)
***Written 7 pm Tuesday evening for Wednesday’s trading and contribution to Mr. TopStep’s Opening Print Publication.
Tuesday’s Session was Cycle Day 1 (CD1): Shallow decline which fell short of the CD1 Average Decline was an early “tell” that bullish bias was well intact anticipating a strong session with Month & Quarter End respectively. The session fulfilled upside range projections with a Market on Close Buy Imbalance of $6 Billion.
…Transition from Cycle Day 1 to Cycle Day 2
This leads us into Cycle Day 2 (CD2): Having fulfilled upside cycle objectives and expectation is for some “back n fill” trade action, we then have two scenarios to consider.
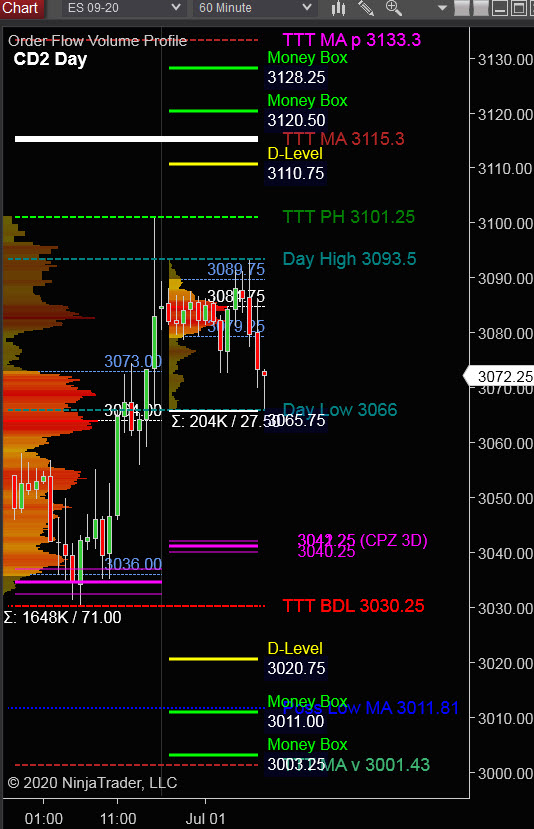
1.) Price sustains a bid above 3075, initially targeting 3090 – 3105 zone with 3 Day Cycle Target 3115.
2.) Price sustains an offer below 3075 initially targeting 3060 – 3050 zone.
P -VA High = 3075 P – VA Low = 3036 P – POC = 3065
Range Projections and Key Levels (ES) September 2020 (U) Contract
HOD ATR Range Projection: 3090; LOD ATR Range Projection: 3040; 3 Day Central Pivot: 3040; 3 Day Cycle Target: 3115; 10 Day Average True Range 60; VIX: 31
Nasdaq 100 (NQ)
Today is Cycle Day 2 (CD2)… Price is consolidating at top end of prior session’s range. Today we have two scenarios to consider:
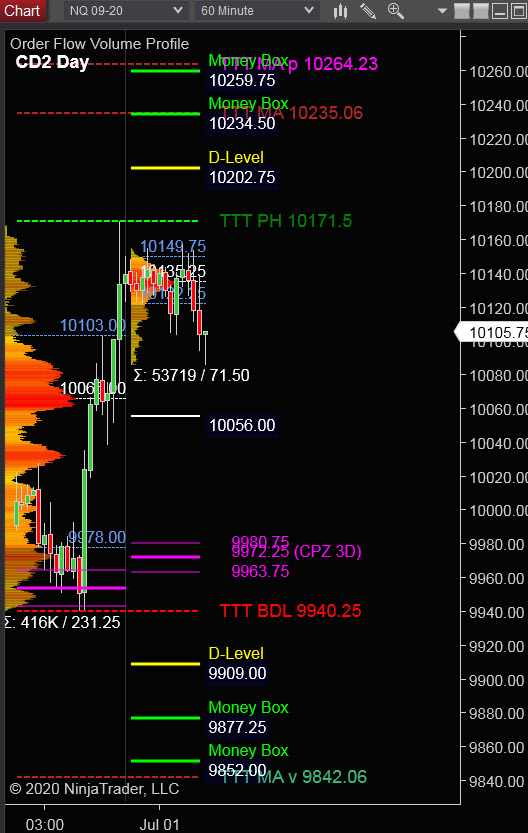
P – VA High = 10103 P – VA Low = 9977 P – POC = 10065
Bull Scenario: IF Bulls hold bid above 10103, THEN initial upside estimate targets 10130 – 10160 zone.
Bear Scenario: IF Bears hold offer below 10103, THEN initial downside estimate targets 10065 – 10035 zone.
Range Projections and Key Levels (NQ) September 2020 (U) Contract
HOD ATR Range Projection: 10134; LOD ATR Range Projection: 9977; 3 Day Central Pivot: 9972; 3 Day Cycle Target: 10235; 10 Day Average True Range: 194; VIX: 31
Trade Strategy: Our tactical trade strategy will simply remain unaltered…We’ll be flexible to trade both long and short side from Decision Pivot Levels. Continue to focus on Bull/Bear Stackers and Premium/Discounts. As always, remaining in alignment with dominant intra-day force increases probabilities of producing winning trades.
Stay Focused…Non-Biased…Disciplined ALWAYS USE STOPS!
Good Trading…David
“Knowing is not enough, We must APPLY. Willing is not enough, We must DO.” –Bruce Lee
*****This trade strategy report is disseminated for “education only” and should not be viewed in any way as a recommendation to buy or sell futures products.”
PAST PERFORMANCE IS NOT NECESSARILY INDICATIVE OF FUTURE RESULTS
IMPORTANT NOTICE! No representation is being made that the use of this strategy or any system or trading methodology will generate profits. Past performance is not necessarily indicative of future results. There is substantial risk of loss associated with trading securities and options on equities. Only risk capital should be used to trade. Trading securities is not suitable for everyone.
Disclaimer: Futures, Options, and Currency trading all have large potential rewards, but they also have large potential risk. You must be aware of the risks and be willing to accept them in order to invest in these markets. Don’t trade with money you can’t afford to lose.
This website is neither a solicitation nor an offer to Buy/Sell futures, options, or currencies. No representation is being made that any account will or is likely to achieve profits or losses similar to those discussed on this web site. The past performance of any trading system or methodology is not necessarily indicative of future results.
CFTC RULE 4.41 –HYPOTHETICAL OR SIMULATED PERFORMANCE RESULTS HAVE CERTAIN LIMITATIONS. UNLIKE AN ACTUAL PERFORMANCE RECORD, SIMULATED RESULTS DO NOT REPRESENT ACTUAL TRADING. ALSO, SINCE THE TRADES HAVE NOT BEEN EXECUTED, THE RESULTS MAY HAVE UNDER-OR-OVER COMPENSATED FOR THE IMPACT, IF ANY, OF CERTAIN MARKET FACTORS, SUCH AS LACK OF LIQUIDITY. SIMULATED TRADING PROGRAMS IN GENERAL ARE ALSO SUBJECT TO THE FACT THAT THEY ARE DESIGNED WITH THE BENEFIT OF HINDSIGHT. NO REPRESENTATION IS BEING MADE THAT ANY ACCOUNT WILL OR IS LIKELY TO ACHIEVE PROFIT OR LOSSES SIMILAR TO THOSE SHOWN