
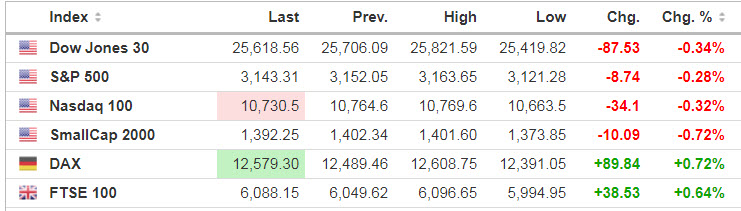
Markets
U.S. stock index futures are all inching lower premarket, the same pattern is being seen as the Dow and S&P 500 lead losses at 0.5% and the Nasdaq behind at 0.2%.
Source: SeekingAlpha.com
Economic Calendar
8:30 Producer Price Index
1:00 PM Baker-Hughes Rig Count
2:00 PM Treasury Budget
https://www.investing.com/economic-calendar/
***New: PTG Trading Room Chat Log’s Link
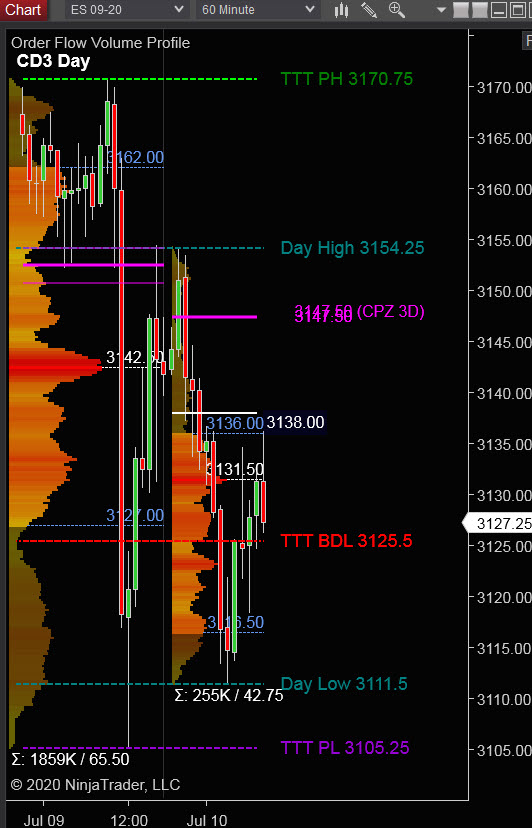
S&P 500
Prior Session was Cycle Day 2 (CD2): Early strength reversed quickly as price sold down testing the July 2nd Low (3105). Buyers responded also aggressively, reversing price back higher, settling near mid of session.
…Transition from Cycle Day 2 to Cycle Day 3
This leads us into Cycle Day 3 (CD3): Price is above the CD1 Low and as such Positive 3 Day Cycle Statistic. Pre-RTH price is currently trading mid zone, so we’ll mark today as a “wild-card”. Meaning price can move freely in either direction as prior range is quite wide. We have two scenarios to consider for today’s session:
1.) Price sustains a bid above 3130, initially targeting 3145 – 3155 zone.
2.) Price sustains an offer below 3130 initially targeting 3115 – 3105 zone.
*****3 Day Cycle has a 91% probability of fulfilling Positive Statistic covering 12 years of recorded tracking history.
PVA High Edge = 3162 PVA Low Edge = 3128 Prior POC = 3142
Range Projections and Key Levels (ES) September 2020 (U) Contract
HOD ATR Range Projection: 3162; LOD ATR Range Projection: 3104; 3 Day Central Pivot: 3147; 3 Day Cycle Target: 3230; 10 Day Average True Range 50; VIX: 30
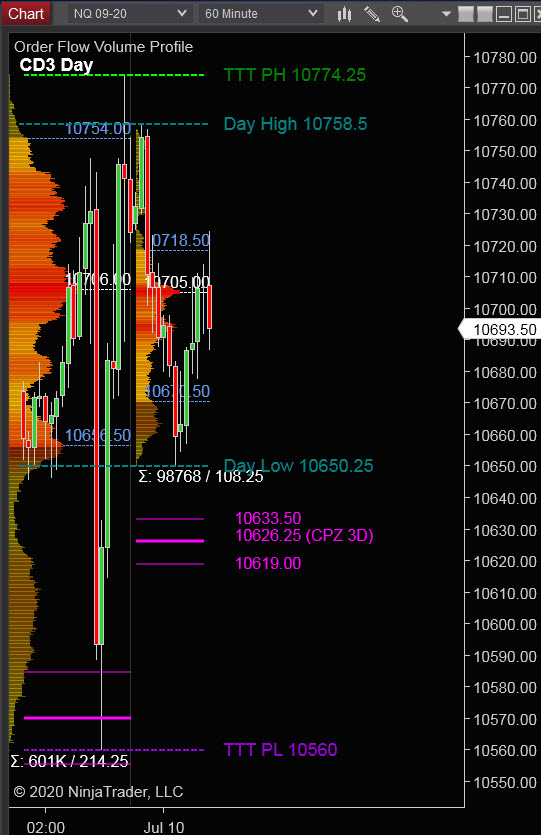
Nasdaq 100 (NQ)
Today is Cycle Day 3 (CD3)…Price again made a new all-time high in prior “range-runner” session. Currently pre-RTH price is trading mid-range and as such we’ll mark today as a “wild-card day. Meaning price can move in either direction as range is quite wide. We have two scenarios to consider for today’s session:
PVA High Edge = 10574 PVA Low Edge = 10656 Prior POC = 10706
Bull Scenario: IF Bulls sustain a bid above 10700, THEN initial upside estimate targets 10730 – 10745 zone.
Bear Scenario: IF Bears sustain an offer below 10700, THEN initial downside estimate targets 10670 – 10650 zone.
Range Projections and Key Levels (NQ) September 2020 (U) Contract
HOD ATR Range Projection: 10845; LOD ATR Range Projection: 10564; 3 Day Central Pivot: 10626; 3 Day Cycle Target: 10835; 10 Day Average True Range: 194; VIX: 30
Trade Strategy: Our tactical trade strategy will simply remain unaltered…We’ll be flexible to trade both long and short side from Decision Pivot Levels. Continue to focus on Bull/Bear Stackers and Premium/Discounts. As always, remaining in alignment with dominant intra-day force increases probabilities of producing winning trades.
Stay Focused…Non-Biased…Disciplined ALWAYS USE STOPS!
Good Trading…David
“Knowing is not enough, We must APPLY. Willing is not enough, We must DO.” –Bruce Lee
*****This trade strategy report is disseminated for “education only” and should not be viewed in any way as a recommendation to buy or sell futures products.”
PAST PERFORMANCE IS NOT NECESSARILY INDICATIVE OF FUTURE RESULTS
IMPORTANT NOTICE! No representation is being made that the use of this strategy or any system or trading methodology will generate profits. Past performance is not necessarily indicative of future results. There is substantial risk of loss associated with trading securities and options on equities. Only risk capital should be used to trade. Trading securities is not suitable for everyone.
Disclaimer: Futures, Options, and Currency trading all have large potential rewards, but they also have large potential risk. You must be aware of the risks and be willing to accept them in order to invest in these markets. Don’t trade with money you can’t afford to lose.
This website is neither a solicitation nor an offer to Buy/Sell futures, options, or currencies. No representation is being made that any account will or is likely to achieve profits or losses similar to those discussed on this web site. The past performance of any trading system or methodology is not necessarily indicative of future results.
CFTC RULE 4.41 –HYPOTHETICAL OR SIMULATED PERFORMANCE RESULTS HAVE CERTAIN LIMITATIONS. UNLIKE AN ACTUAL PERFORMANCE RECORD, SIMULATED RESULTS DO NOT REPRESENT ACTUAL TRADING. ALSO, SINCE THE TRADES HAVE NOT BEEN EXECUTED, THE RESULTS MAY HAVE UNDER-OR-OVER COMPENSATED FOR THE IMPACT, IF ANY, OF CERTAIN MARKET FACTORS, SUCH AS LACK OF LIQUIDITY. SIMULATED TRADING PROGRAMS IN GENERAL ARE ALSO SUBJECT TO THE FACT THAT THEY ARE DESIGNED WITH THE BENEFIT OF HINDSIGHT. NO REPRESENTATION IS BEING MADE THAT ANY ACCOUNT WILL OR IS LIKELY TO ACHIEVE PROFIT OR LOSSES SIMILAR TO THOSE SHOWN