
Markets
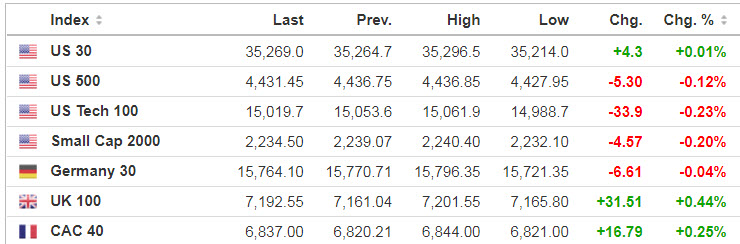
Source: SeekingAlpha.com
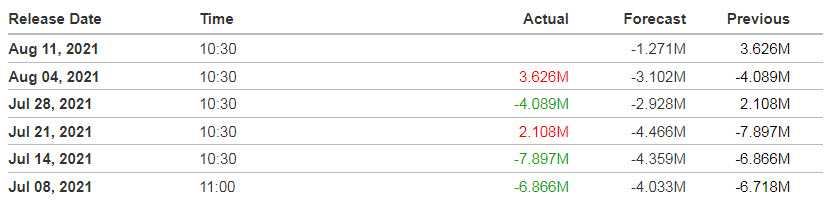
Economic Calendar
10:00 Atlanta Fed’s Business Inflation Expectations
1:00 PM Results of $41B, 10-Year Note Auction
2:00 PM Treasury Budget
https://www.investing.com/economic-calendar/
***New: PTG Trading Room Chat Log’s Link
 10:30 EIA Petroleum Inventories
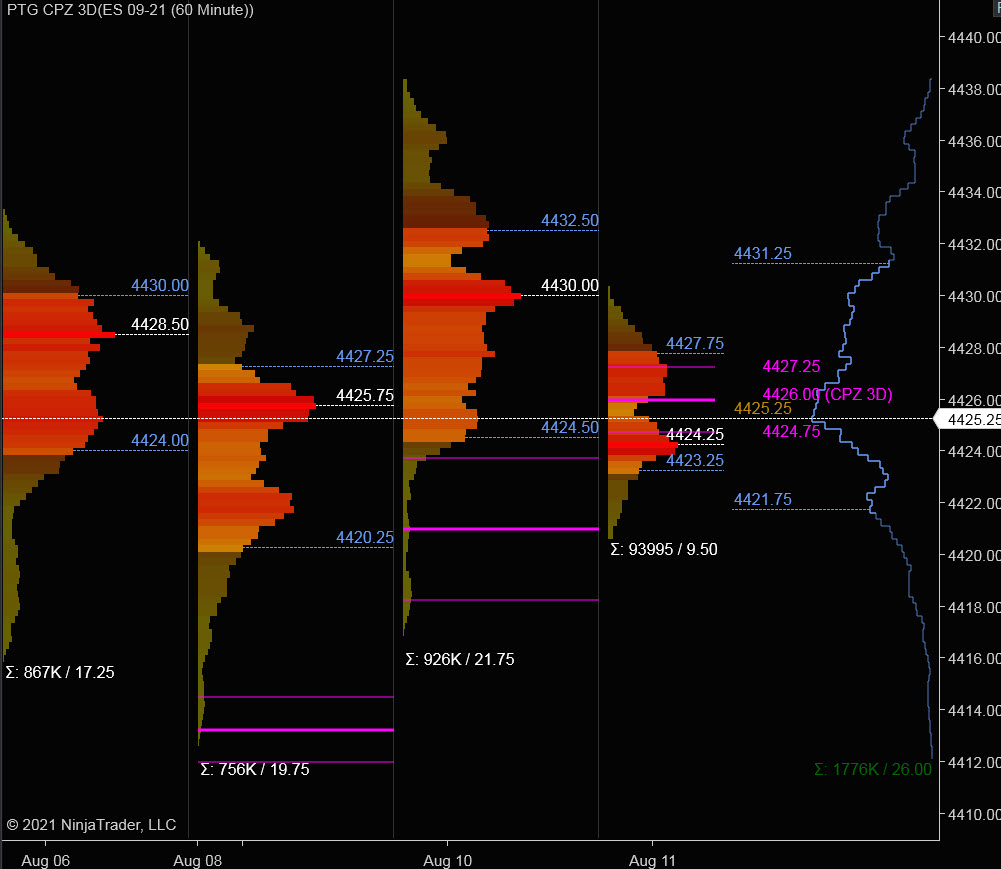
S&P 500

***Written 8 pm Tuesday evening for Wednesday’s trading for contribution to MrTopStep’s “The Opening Print” publication.
Tuesday’s Session was Cycle Day 1 (CD1): Price continues to consolidate near all-time highs with sub-par range and volume. The BTFD Crowd remains active on any sign of weakness, as this cycle day’s decline was easily absorbed at 4420 – 4424 support zone. Range was 21.75 handles on 926k contracts exchanged.
…Transition from Cycle Day 1 to Cycle Day 2
This leads us into Cycle Day 2 (CD2): Five-Day Value Zone between 4420 – 4432 is the trader’s sandbox. Until either of these levels are broken, expectation is for more of the same, with Cycle Day 2 consolidation. As such, estimated scenarios to consider for today’s trading.
1.) Price sustains a bid above 4432, initially targets 4448 – 4450 zone.
2.) Price sustains an offer below 4420, initially targets 4405 – 4400 zone.
*****3 Day Cycle has a 91% probability of fulfilling Positive Cycle Statistics covering 12 years of recorded tracking history.
For more detailed information for both bullish and bearish projected targets, please visit: PTG 3 Day Cycle and/or reference the Cycle Spreadsheet below:
Link to access full Cycle Spreadsheet > > Cycle Day 2 (CD2)

PVA High Edge = 4433 PVA Low Edge = 4425 Prior POC = 4430
Range Projections and Key Levels (ES) Sept 2021 (U) Contract
HOD ATR Range Projection: 4448; LOD ATR Range Projection: 4402; 3 Day Central Pivot: 4426; 3 Day Cycle Target: 4450; 10 Day Average True Range 27; VIX: 17
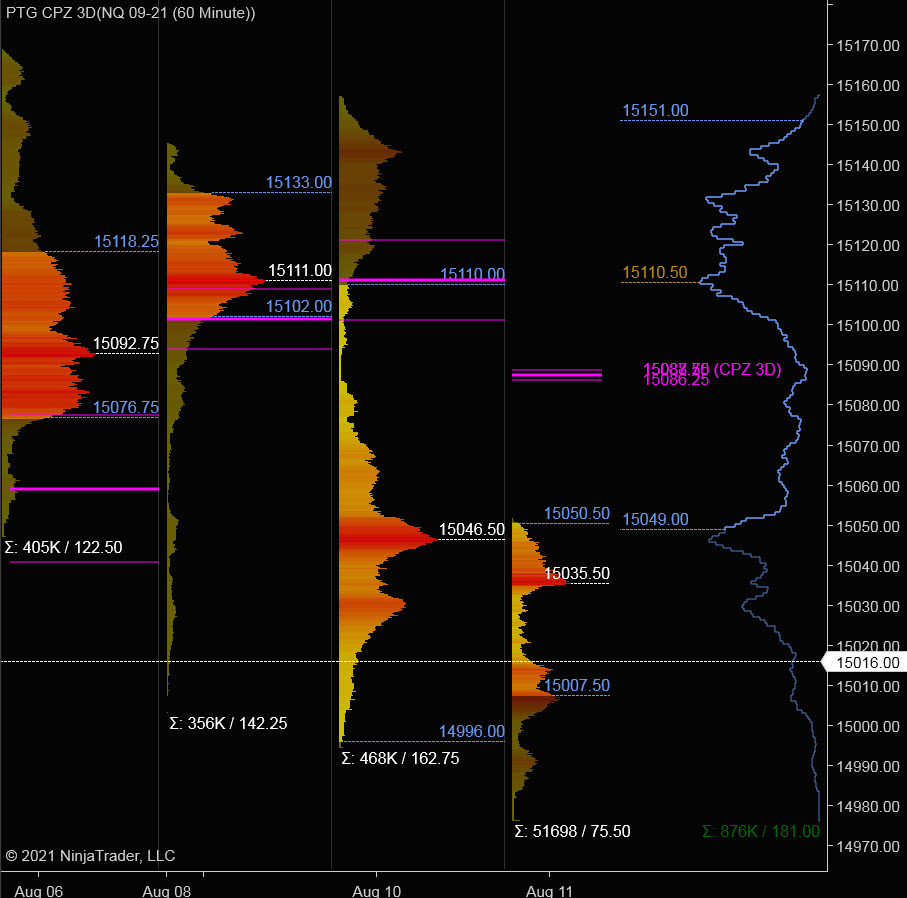
Nasdaq 100 (NQ)

Today is Cycle Day 2 (CD2)…Price is currently trading at lower-end of 5-day range pre-RTH as NQ has exhibited relative weakness compared to ES. Prior range was 163 handles on 468k contracts exchanged. As such, there are two estimated scenarios to consider for today’s trading.
PVA High Edge = 15110 PVA Low Edge = 14996 Prior POC = 15046
Bull Scenario: IF Bulls sustain a bid above 15000, THEN initial upside estimate targets 15040 – 15060 zone.
Bear Scenario: IF Bears sustain an offer below 15000, THEN initial downside estimate targets 14975 – 14950 zone.
Range Projections and Key Levels (NQ) Sept 2021 (U) Contract
HOD ATR Range Projection: 15110; LOD ATR Range Projection: 14918; 3 Day Central Pivot: 19088; 3 Day Cycle Target: 15080; 10 Day Average True Range: 133; VIX: 17
Trade Strategy: Our tactical trade strategy will simply remain unaltered…We’ll be flexible to trade both long and short side from Decision Pivot Levels. Continue to focus on Bull/Bear Stackers and Premium/Discounts. As always, remaining in alignment with dominant intra-day force increases probabilities of producing winning trades.
Stay Focused…Non-Biased…Disciplined ALWAYS USE STOPS!
Good Trading…David
“Knowing is not enough, We must APPLY. Willing is not enough, We must DO.” –Bruce Lee
*****This trade strategy report is disseminated for “education only” and should not be viewed in any way as a recommendation to buy or sell futures products.”
PAST PERFORMANCE IS NOT NECESSARILY INDICATIVE OF FUTURE RESULTS
IMPORTANT NOTICE! No representation is being made that the use of this strategy or any system or trading methodology will generate profits. Past performance is not necessarily indicative of future results. There is substantial risk of loss associated with trading securities and options on equities. Only risk capital should be used to trade. Trading securities is not suitable for everyone.
Disclaimer: Futures, Options, and Currency trading all have large potential rewards, but they also have large potential risk. You must be aware of the risks and be willing to accept them in order to invest in these markets. Don’t trade with money you can’t afford to lose.
This website is neither a solicitation nor an offer to Buy/Sell futures, options, or currencies. No representation is being made that any account will or is likely to achieve profits or losses similar to those discussed on this web site. The past performance of any trading system or methodology is not necessarily indicative of future results.
CFTC RULE 4.41 –HYPOTHETICAL OR SIMULATED PERFORMANCE RESULTS HAVE CERTAIN LIMITATIONS. UNLIKE AN ACTUAL PERFORMANCE RECORD, SIMULATED RESULTS DO NOT REPRESENT ACTUAL TRADING. ALSO, SINCE THE TRADES HAVE NOT BEEN EXECUTED, THE RESULTS MAY HAVE UNDER-OR-OVER COMPENSATED FOR THE IMPACT, IF ANY, OF CERTAIN MARKET FACTORS, SUCH AS LACK OF LIQUIDITY. SIMULATED TRADING PROGRAMS IN GENERAL ARE ALSO SUBJECT TO THE FACT THAT THEY ARE DESIGNED WITH THE BENEFIT OF HINDSIGHT. NO REPRESENTATION IS BEING MADE THAT ANY ACCOUNT WILL OR IS LIKELY TO ACHIEVE PROFIT OR LOSSES SIMILAR TO THOSE SHOWN